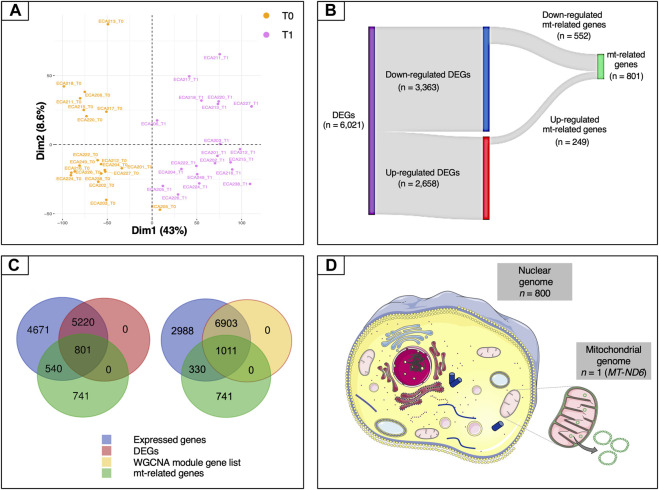
FIGURE 2.
Overview of the mt-related genes. (A) Plot of the first two components of the PCA obtained using all of the expressed genes. (B) Sankey diagram of the differentially expressed genes, showing the numbers of up-regulated, down-regulated and mt-related genes. Only a relatively small fraction of the mt-related genes (249 out of 801) was up-regulated, whereas most (552 out of 801) were down-regulated. (C) Venn diagrams illustrating the overlaps among expressed genes (blue), differentially expressed genes (purple), genes included in WGCNA modules (yellow) and mt-related genes (green). (D) Illustration of the proportion of mt-related genes encoded by the mitochondrial and by the nuclear genomes. Except for MT-ND6, all of the other genes are encoded by the nuclear genome. Data information: in panel D, the picture of the mitochondria was download from https://smart.servier.com. In all cases, no changes were made. Servier Medical Art by Servier is licensed under a Creative Commons Attribution 3.0 Unported License.

