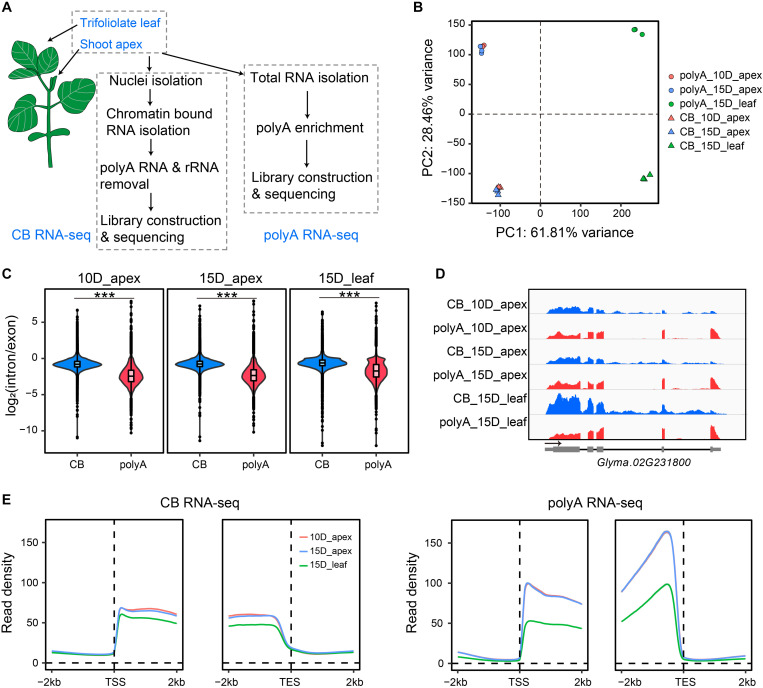
FIGURE 1.
Overview of the experimental design and features of nascent RNA and mRNA. (A) Scheme of chromatin-bound RNA sequencing (CB RNA-seq) and polyA RNA-seq. (B) Principal component analysis (PCA) of gene expression of biological triplicates from CB RNA-seq and polyA RNA-seq. The triangles and dots represent CB RNA-seq and polyA RNA-seq, respectively. Red, 10-day apex; blue, 15-day apex; green, 15-day leaf. (C) Comparison of the gene intron/exon ratio between CB RNA-seq and polyA RNA-seq (left, 10-day apex; middle, 15-day apex; right, 15-day leaf). ***p < 0.001, Wilcoxon test. (D) Screenshot of IGV showing the read distribution of CB RNA-seq and polyA RNA-seq on the Glyma.02G231800 gene. Blue, CB RNA-seq; red, polyA RNA-seq. (E) Profiles of read density of CB RNA-seq (left) and polyA RNA-seq (right) for the 2-kb up- and downstream transcription start site (TSS) and transcription end site (TES). Lines represent the mean value of read density. Ten-day apex, 15-day apex, and 15-day leaf samples are indicated in red, blue, and green, respectively.

