FIGURE 4.
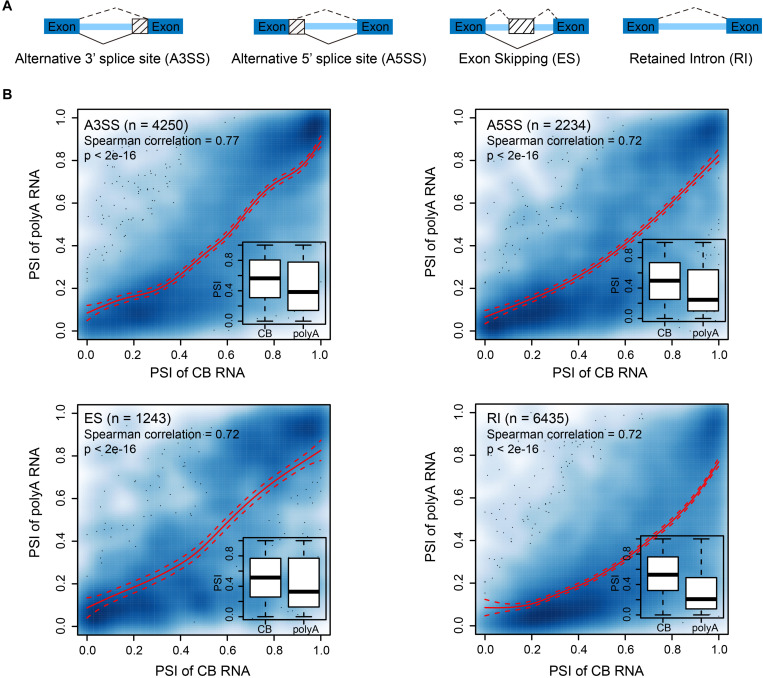
Alternative splicing events are likely determined cotranscriptionally. (A) Diagram showing the different alternative splicing events analyzed. (B) Scatter plots showing the correlation between the percent spliced-in (PSI) values of CB RNA and polyA RNA of different AS events in 15-day apex tissues. Smooth spline curves were fitted (solid red lines), and 95% confidence intervals were plotted (dashed red lines). Spearman’s correlation coefficients are presented in the plots. Insets show boxplots of PSIs for AS events at the CB RNA and polyA RNA levels.

