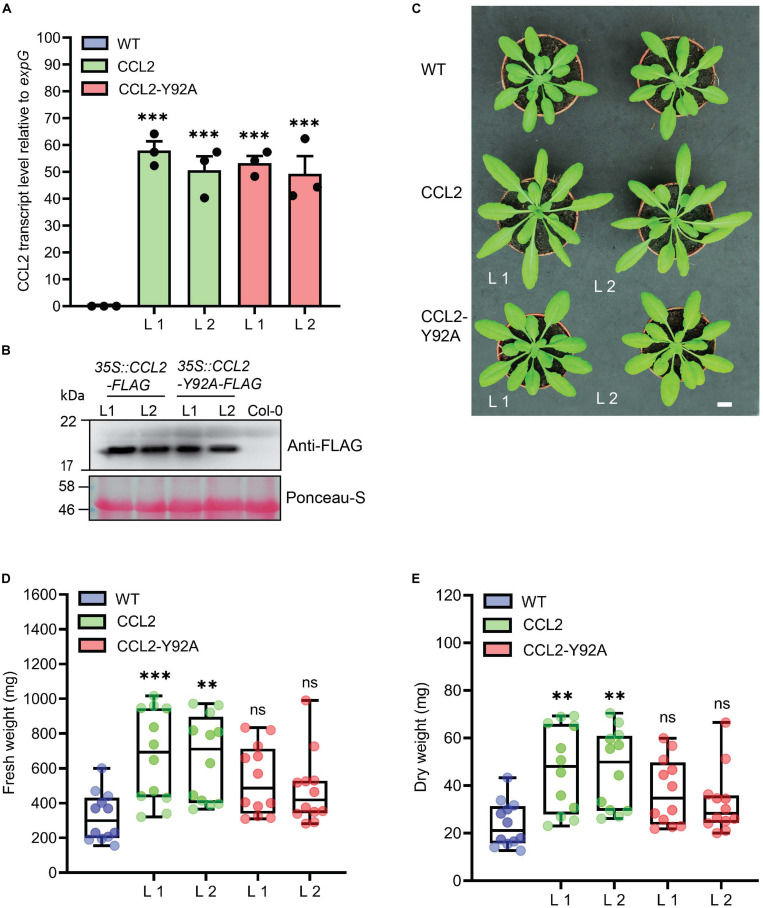
FIGURE 1.
Characterization of CCL2-expressing Arabidopsis lines. (A) qPCR analysis of relative CCL2 and CCL2-Y92A transcript levels in 4-week-old plants. Transcript levels were normalized to expG gene (AT4G26410). Mean values ± SE of three independent experiments. (B) Immunoblot visualizing the expression level of CCL2 and CCL2-Y92A proteins. FLAG-tagged proteins were detected with anti-FLAG antibodies. Ponceau-S stained Rubisco large subunit served as loading control. Size bar = 1 cm (C) Growth phenotype of transgenic lines compared to WT. Two independent lines (L1 and L2) are shown for each construct. (D) Fresh weight (FW) and (E) dry weight (DW) of shoots of 4-week-old plants (n = 12; three independent experiments). Boxplots represent median and 1.5 times the interquartile range. Asterisks show significant differences between transgenic lines compared to the WT (∗∗∗P ≤ 0.001, ∗∗P ≤ 0.01) determined by one-way ANOVA followed by post hoc analysis with Dunnett’s multiple-comparison test.

