FIGURE 3.
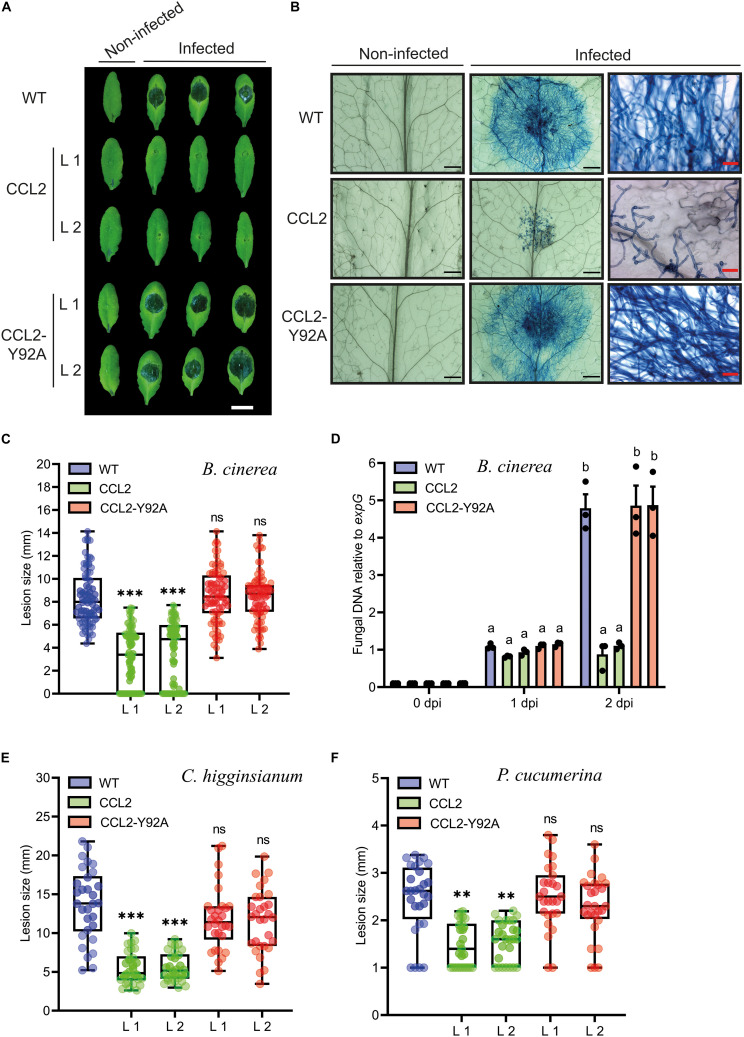
Resistance of CCL2-expressing plants toward fungal pathogens. (A) Necrotic lesions caused by B. cinerea infection on leaves of 4-week-old WT, CCL2- and CCL2-Y92A lines inoculated with 6 μL droplets of a spore suspension (5 × 10⁴ spores mL–1). Plants were photographed 3 dpi. Size bar = 1 cm. (B) Trypan Blue-staining of Arabidopsis leaves 60 hpi. The right-side shows close-up images. Black or red size bares are 1 mm and 50 μm, respectively. (C) Quantification of lesion size at 3 dpi. Boxplots represent median and 1.5 times the interquartile range (n = 80 from three independent experiments). (D) Quantification of fungal DNA by qPCR at 0, 1, and 2 dpi. The fungal Cutinase A gene (Genebank: Z69264) was quantified relative to expG gene (AT4G26410) of Arabidopsis. Bars represent mean values ± SE from three independent experiments. (E) Analysis of lesion size of 5-week-old WT and transgenic CCL2 lines droplet-inoculated with C. higginsianum (10 μL of 2 × 10⁶ spores mL–1 per leaf). Plants were analyzed 10 dpi. (F) Analysis of lesion size of 4-week-old WT and CCL2 lines, droplet-inoculated with P. cucumerina (10 μL of 5 × 10⁶ spores mL–1 per leaf). Plants were analyzed 5 dpi. Boxplots (E,F) represent median and 1.5 times the interquartile range (n = 30 from three independent experiments). The data was analyzed by one-way ANOVA and post hoc analysis by Dunnett’s multiple-comparison test. Asterisks show a statistically significant difference between the CCL2 expressing lines and WT plants (∗∗∗P ≤ 0.001, ∗∗P ≤ 0.01, ns, not significant). The letters a and b signify a between-group difference at the P ≤ 0.05 level.

