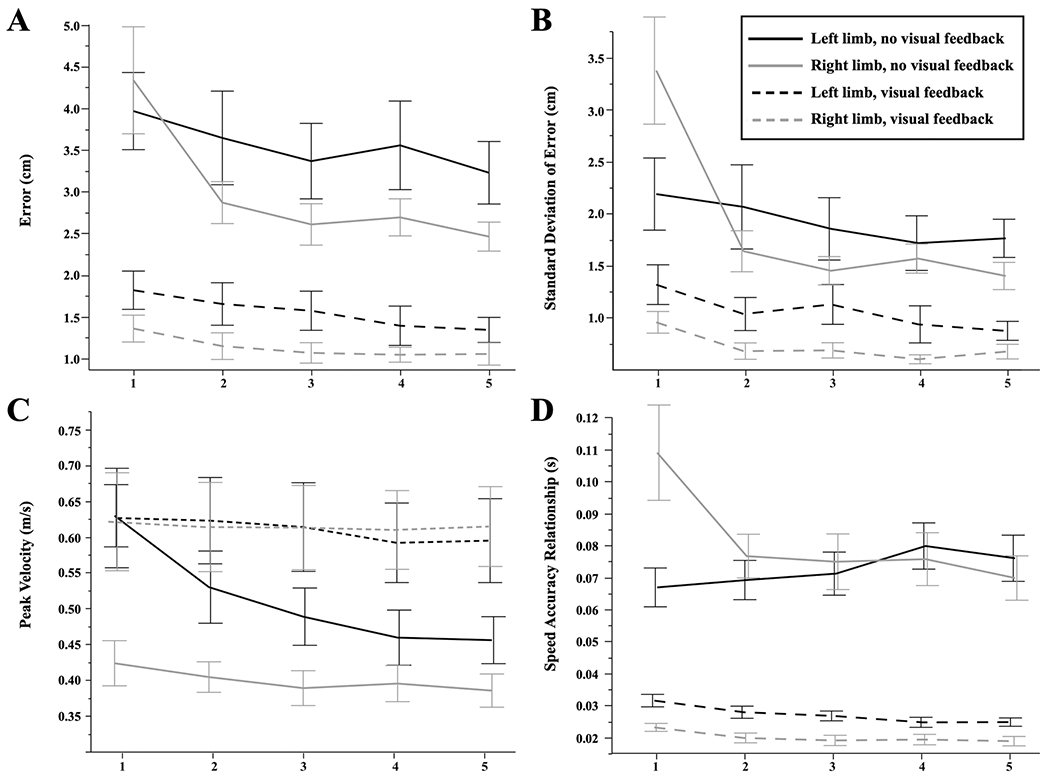
Fig. 2.

Performance across groups. Each cycle represents a reach to all 32 target locations in pseudorandom order. Error bars represent one standard error from the mean. a Final position error. b Standard deviation of error. c Peak tangential velocity. d Speed-accuracy relationships (error/speed)
