Fig. 3.

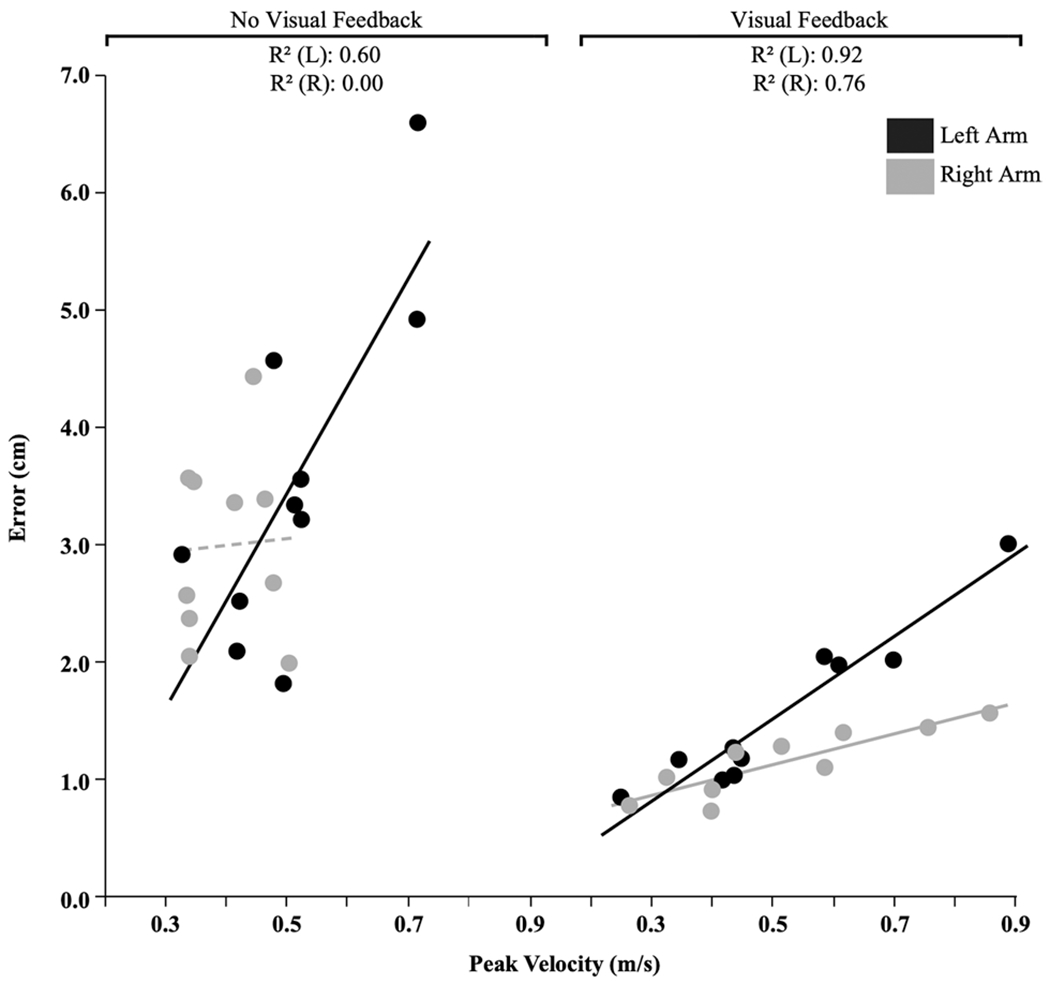
Relationship between speed and accuracy across all cycles. Each point represents participant averages collapsed across cycle and target. Note: the dashed line represents a statistically insignificant line of fit (p = 0.8913)

Relationship between speed and accuracy across all cycles. Each point represents participant averages collapsed across cycle and target. Note: the dashed line represents a statistically insignificant line of fit (p = 0.8913)