
. 2021 Feb 23;3(4):239–249. doi: 10.1002/acr2.11229
© 2021 The Authors. ACR Open Rheumatology published by Wiley Periodicals LLC on behalf of American College of Rheumatology.
This is an open access article under the terms of the http://creativecommons.org/licenses/by-nc-nd/4.0/ License, which permits use and distribution in any medium, provided the original work is properly cited, the use is non‐commercial and no modifications or adaptations are made.
Figure 2.
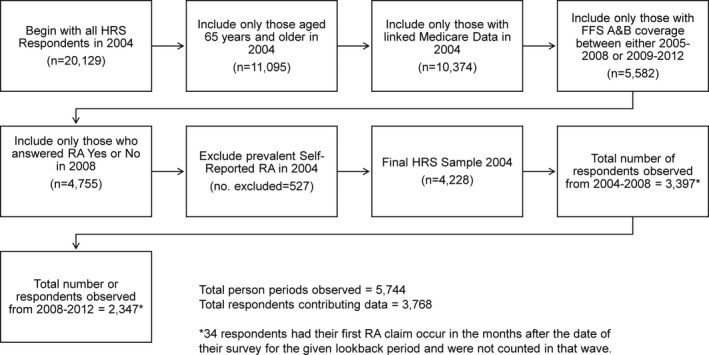
Study sample flow chart.