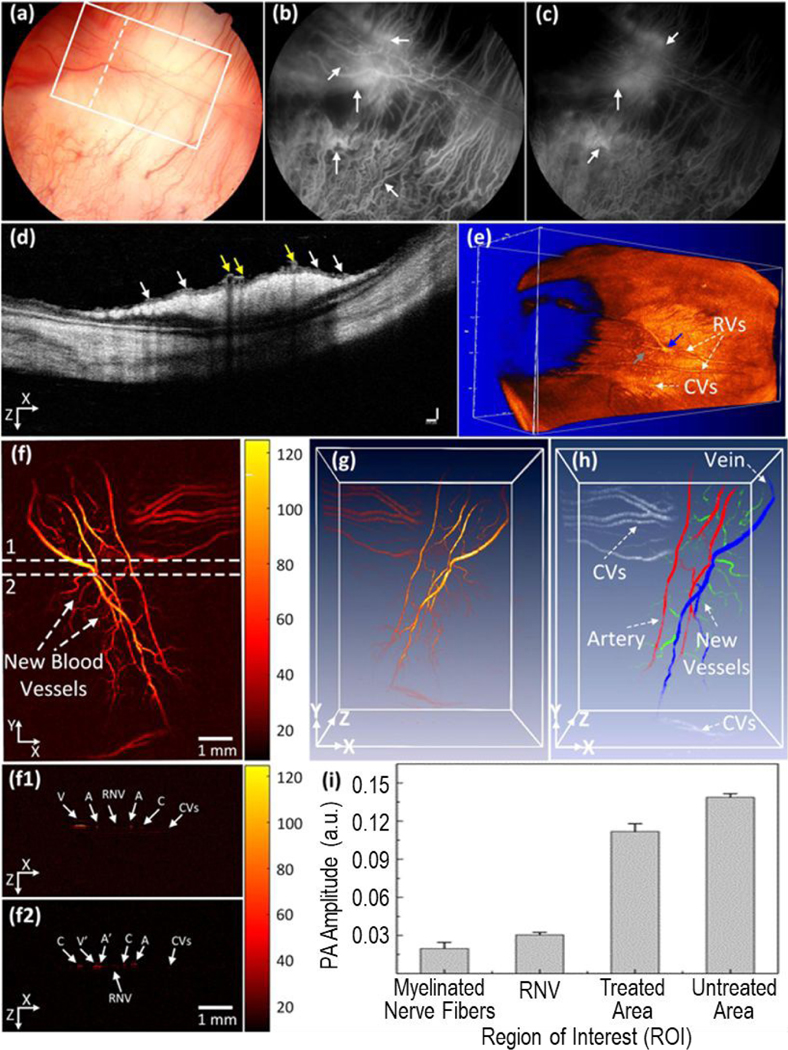
Figure 3.
Multimodal imaging of retinal neovascularization. (a) Color fundus image of the retina. White rectangle shows the selected scanning region of photoacoustic microscope images and whited dotted line show the scanning line position (OCT). (b, c) Fluorescein angiography image at early phase and late phase. White arrows show the position of retinal neovascularization. (d) B-scan OCT image acquired along the dotted line in (a). White arrows indicate the position of retinal neovascularization (RNVs), whereas yellow arrows represent the location of treated retinal vessels. (e) 3D rendering OCT image. Blue arrow shows the treated areas with higher contrast in comparison with the background. Gray arrow depicts the location of the artery. (f) Corresponding photoacoustic microscopic images after laser irradiation at day 28. It shows clearly the structure of individual retinal blood vessels including RNVs, choroidal vessels (CVs), retinal vessels (RVs), and capillaries. (f1 and f2) B-scan images from upper and lower dotted lines in (f). (g) 3D rendering photoacoustic microscopic images. (h) Segmentation image of retinal vessels for RNV identification. Pseudo-color blue, red, white, and green indicate the position of vein, artery, choroidal vessels and RNV, respectively. (i) Comparison of maximum PA signals at different positions on rabbit retinal vessel after treatment (*p < 0.001 and N = 4). The PA signal slightly decreased after laser treatment. Reprinted from [77]. Copyright (2019) Springer Nature.

