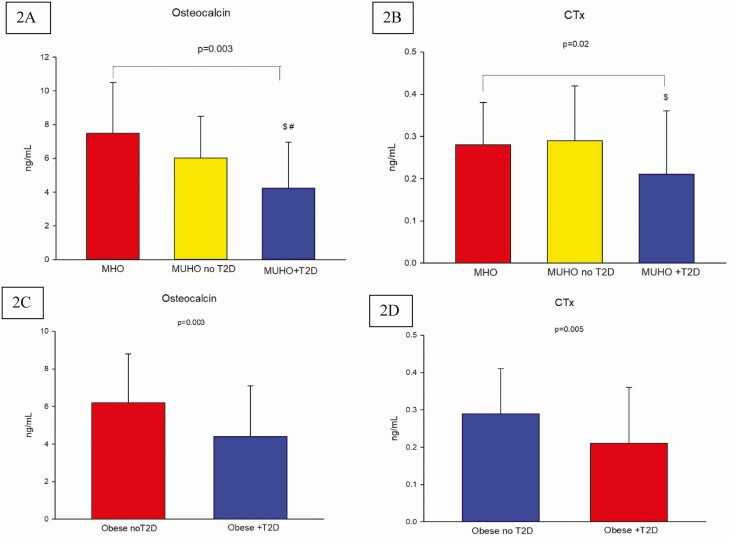
Figure 2.
Osteocalcin and C-terminal telopeptide of type 1 collagen (CTx) serum levels in metabolically healthy obese (MHO), metabolically unhealthy obese without T2D (MUHO no T2D) and MUHO with T2D (MUHO + T2D); error bars represent SD. post-hoc analysis for Osteocalcin showed P-value < 0.05 for the comparison between MUHO with T2D vs MHO$ and vs MUHO without T2D (A); post-hoc analysis for CTx showed P-value < 0.05 for the comparison between MUHO with T2D vs MUHO without T2D. $P < 0.05 for comparison of MUHO with T2D to MHO; #P < 0.05 for comparison of MUHO with T2D to MUHO without T2D (B). Comparison of osteocalcin levels between obese subjects without and with T2D showed a P-value 0.003 (C), and CTx levels between obese subjects without and with T2D showed P-value of 0.0005 (D).

