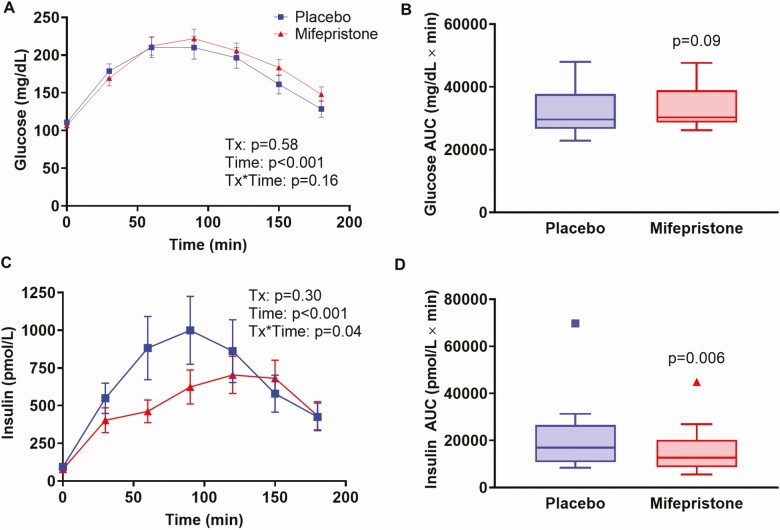
Figure 4.
Time profiles of plasma glucose and insulin following an OGTT in study participants after receiving either placebo or mifepristone. Time course of plasma glucose (A) and insulin (C) during OGTT. Data shown are mean ± SEM. P-values for the effects of treatment group, time, and the treatment*time interaction were obtained with repeated-measures analysis of variance with post-hoc Bonferroni’s test. Tukey box-and-whisker plots of glucose (B) and insulin (D) area under the curve for the duration of 3-h OGTT. Top and bottom box limits represent the 75th and 25th percentile, respectively; midlines represent the median; and top and bottom whiskers represent the 75th percentile plus 1.5 of the interquartile range and the 25th percentile minus 1.5 interquartile range, respectively. Symbols represent any values that lie outside the range of the whiskers. Posttreatment values were adjusted for baseline value and treatment group using mixed-model regression. P-values indicate significance for comparisons between mifepristone and placebo.

