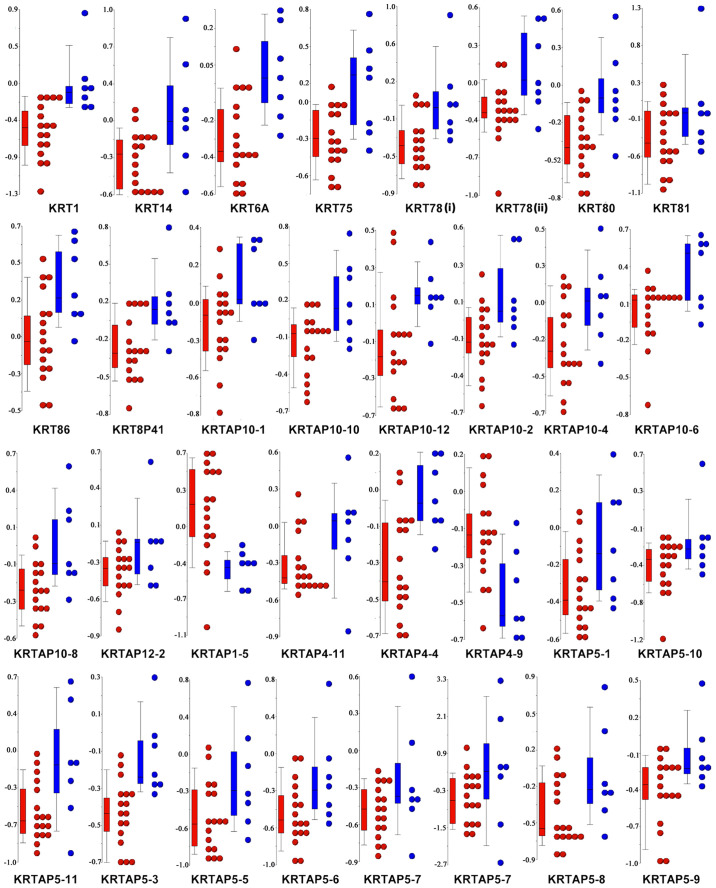
Figure 5.
Methylation levels of keratin filament genes in FBC compared with MBC. Dot plots were generated by Partek Genomics Suite and represent the DMRs associated with GO term ‘GO: 0045095: Keratin filament’ in FBC compared with MBC. Each graph refers to a specific KRT gene and KRTAP genes. Within a graph a point represents the Δ methylation value of a DMR for a given breast cancer case. FBC cases are shown in red and MBC cases are shown in blue. A total of two DMRs were detected for the KRT78 gene, indicated as (i) and (ii). The numbers on the y-axis are Δ methylation values. DMR, differentially methylated region; FBC, female breast cancer; GO, Gene Ontology; KRT, keratin; KRTAP, keratin-associated protein; MBC, male breast cancer.

