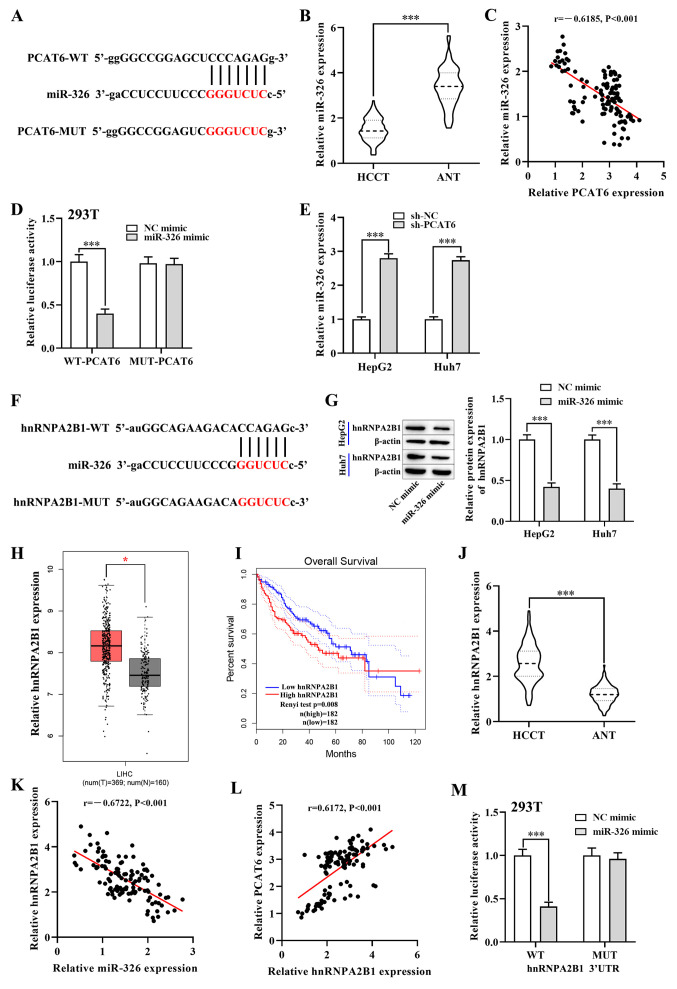
Figure 3.
PCAT6 promotes hnRNPA2B1 expression in liver cancer cells by targeting miR-326. (A) Starbase predicted binding sites between miR-326 and PCAT6. (B) RT-qPCR detected the expression of miR-326 in HCCT (n=117) and matched ANT. (C) Pearsons correlation analysis between PCAT6 and miR-326 in liver cancer tissues. (D) Luciferase reporter assays were performed in 293T cells to detect the binding affinity of miR-326 to the PCAT6 3UTR-WT or MUT. (E) Expression of miR-326 in both HepG2 and Huh7 cells after transfection with sh-PCAT6 or sh-NC examined using RT-qPCR. (F) Starbase database binding site predictions between miR-326 and hnRNPA2B1. (G) Protein levels of hnRNPA2B1 in both HepG2 and Huh7 cells after transfection with miR-326 mimic and NC mimic were examined using western blotting. (H) Expression of hnRNPA2B1 in liver cancer tissues (n=369) and normal tissues (n=160) from the GEPIA database. (I) Association between hnRNPA2B1 expression and overall survival rate of patients with liver cancer was analyzed using GEPIA database. (J) RT-qPCR detected the mRNA levels of hnRNPA2B1 in HCCT (n=117) and matched ANT. (K and L) Correlation between hnRNPA2B1 and PCAT6 or miR-326 in liver cancer tissues. (M) Dual-luciferase reporter assay verified the negative regulatory association between miR-326 and hnRNPA2B1 in 293T cells. *P<0.05 and ***P<0.001 compared with respective control. PCAT6, prostate cancer-associated transcript 6; hnRNPA2B1, heterogeneous nuclear ribonucleoprotein A2B1; GEPIA, Gene Expression Profiling Interactive Analysis; RT-qPCR, reverse transcription-quantitative PCR; HCCT, liver cancer tissue; ANT, adjacent normal tissue; miR-, microRNA; WT, wild-type; MUT, mutant; NC, negative control; HR, hazard ratio; LIHC; UTR, untranslated region.

