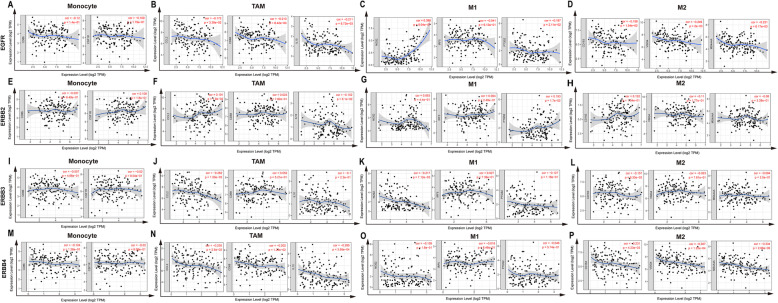
Fig. 5.
EGFR family expression was correlated with macrophage polarization in glioma. Markers include CD86 and CSF1R of monocytes; CCL2, CD68, and IL10 of TAMs (tumor-associated macrophages); NOS2, IRF5, and PTGS2 of M1 macrophages; and CD163, VSIG4, and MS4A4A of M2 macrophages in glioma (n = 153). a-d Scatterplots of correlations between EGFR expression and gene markers of monocytes, TAMs, and M1 and M2 macrophages. e-h Scatterplots of correlations between ERBB2 expression and gene markers of monocytes, TAMs, and M1 and M2 macrophages. i-l Scatterplots of correlations between ERBB3 expression and gene markers of monocytes, TAMs, and M1 and M2 macrophages. m-p Scatterplots of correlations between ERBB4 expression and gene markers of monocytes, TAMs, and M1 and M2 macrophages

