Fig. 4.
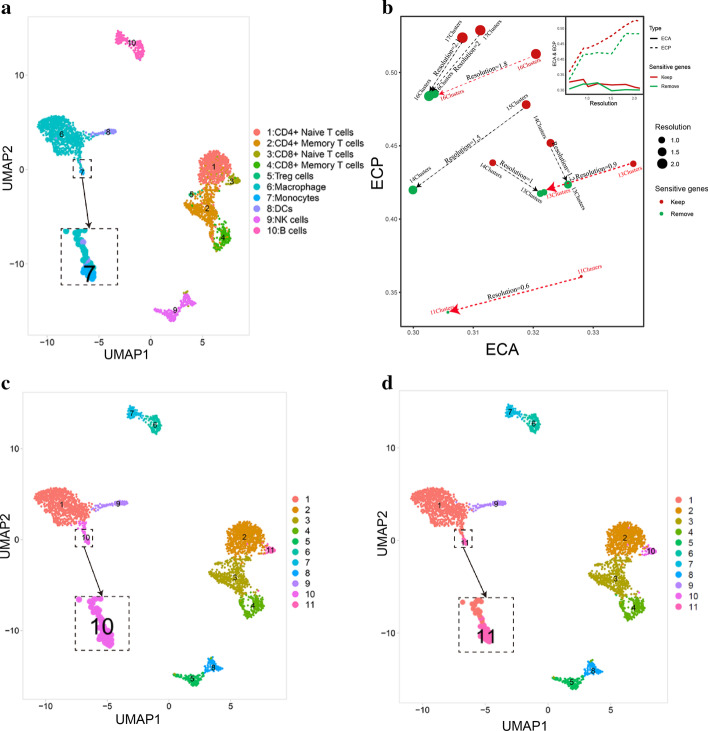
Evaluation of the influence of sensitive genes on unsupervised clustering results. a The ground-truth labels with cell-type annotation of the first sample in PbmcBench PBMC1 data set; b ECA and ECP values in a series of resolution (0.6, 0.9, 1,1.2, 1.5, 1.8, 2) including and removing sensitive genes. Arrows aimed from the group keeping the sensitive genes to the group discarding the sensitive genes. The paired points in two groups with the same number of clusters were marked by red arrows, the paired points in two groups with different number of clusters were marked by black arrows; c The first-time unsupervised clustering result (resolution = 0.6); d The unsupervised clustering result (resolution = 0.6) removing sensitive genes

