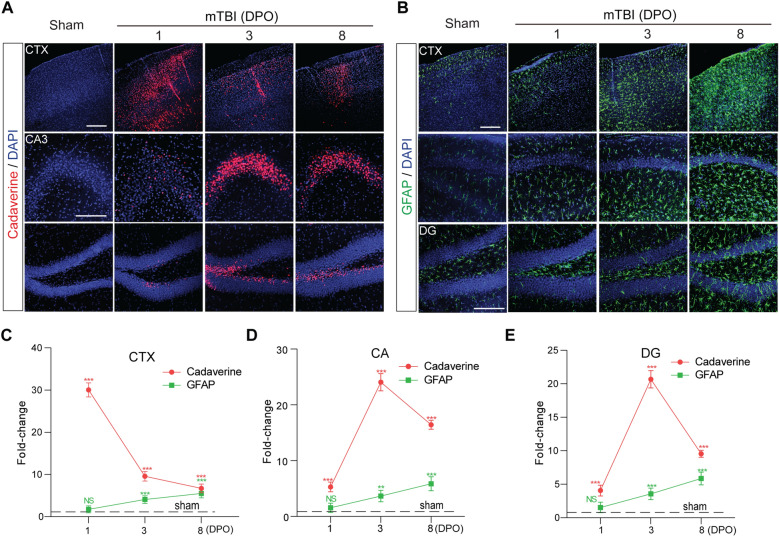
Fig. 4.
The time courses of BBB dysfunction and astrogliosis after mTBI in mice. a Representative confocal microscope images showing the extravasation of intravenously administrated Alexa-555 cadaverine (red) in cortex (CTX), Cornu Ammonis 3 (CA3) and dentate gyrus (DG) area 1-day, 3- and 8- days post operation (DPO). Scale bar = 100 µm. b Representative confocal microscope images showing GFAP-positive astrocytes (green) in cortex (CTX), CA1 and dentate gyrus (DG) area 1-day, 3- and 8- days post operation (DPO). Scale bar = 100 µm. c–e Quantification for the fold changes for cadaverine intensity (n = 5 mice per time point) and GFAP positive cells (n = 5 mice per time point) in CTX area, CA area and DG area 1-day, 3- and 8- days post operation (DPO). In c–e, data are presented as mean ± SD; ***, P < 0.001; **, P < 0.01 NS, non-significant (P > 0.05) compare to sham group, one-way ANOVA followed by Bonferroni’s post-hoc tests. Dash lines indicate the sham-operated group

