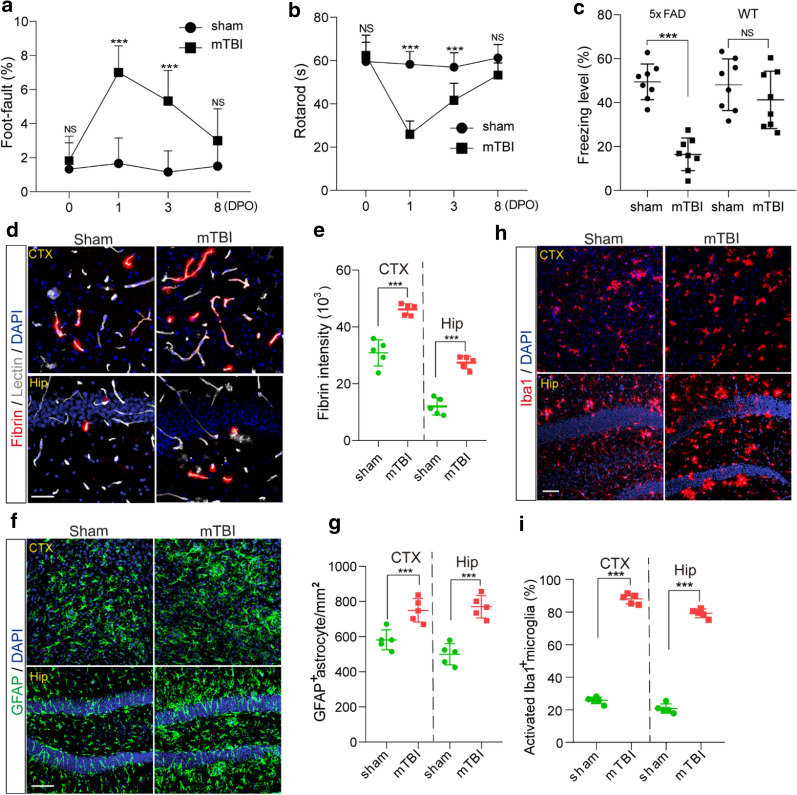
Fig. 5.
Accelerated cognitive impairment and pathologies in 5xFAD mice after mTBI. a–b Foot- fault (A) and Rotarod (b) tests were performed in 3 months old 5xFAD mice on 0, 1, 3 and 8 days after mTBI or sham-operation. n = 8 mice per time point per group. c Contextual fear conditioning test was performed in 3 months old 5xFAD mice 8 days after mTBI or sham-operation as in (a–b), or in non-transgenic littermates (WT) 8 days after mTBI or sham-operation. n = 8 mice per group. d–e Representative images (d) and quantification (e) showing extravascular fibrin deposits in brain parenchyma 8 days after mTBI, in both cortex (CTX) and hippocampus (Hip). Lectin (gray), fibrin (red). n = 5 mice; Scale bar = 50 µm. f–g Representative images (f) and quantification (g) showing GFAP-positive astrocytes in brain parenchyma 8 days after mTBI. GFAP (green). n = 5 mice per group; Scale bar = 50 µm. h Representative images of fluorescence immunostaining for microglial marker Iba1 (red) and DAPI (blue) in brain parenchyma 8 days after mTBI. Scale bar = 50 µm. i Quantification for the percentage of activated Iba1 positive cells in both cortex and hippocampus (n = 5 mice per group). In a–b, Mean ± SD; ***, P < 0.001, NS, non-significant (P > 0.05), one-way ANOVA followed by Bonferroni’s post-hoc tests. In c, e, g, i, Mean ± SD; ***, P < 0.001, NS, non-significant (P > 0.05) by Student’s t-test

