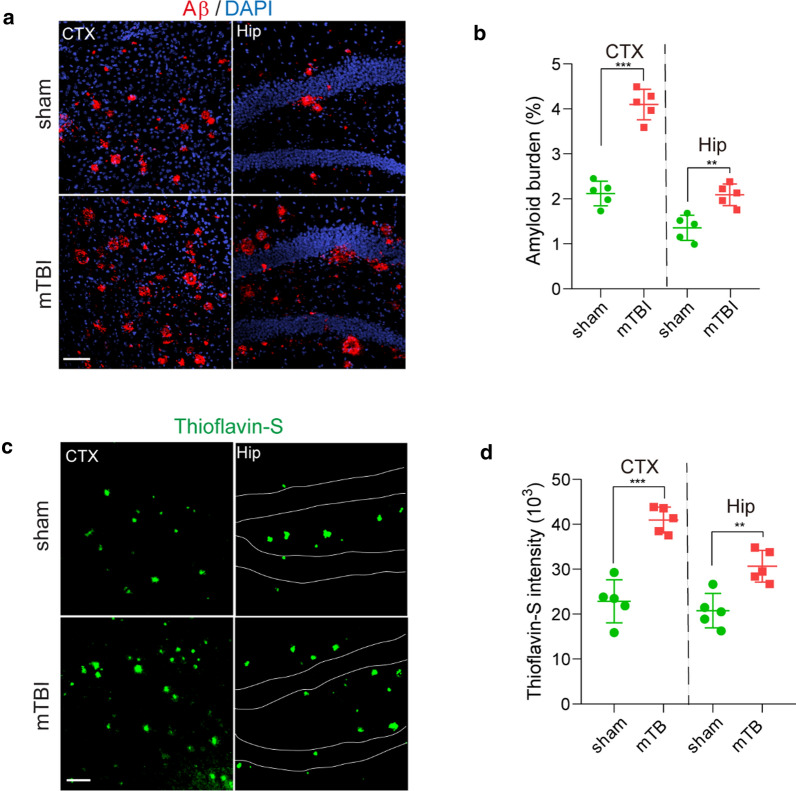
Fig. 6.
Accelerated amyloid pathology in 5xFAD mice after mTBI. a–b Representative images (A) showing immunostaining of brain amyloid deposits (red), DAPI (blue) and quantification (b) for the amyloid burden (based on the percentage of cortical area occupied with Aβ immunostaining) in cortex (CTX) and Hippocampus (Hip) area 8 days post operation. n = 5 mice per group, scale bar = 100 µm. s–d Representative images (c) showing Thioflavin-S labelled amyloid plaques (green) and quantification for the intensity of Thioflavin-S (d) in cortex (CTX) and Hippocampus (Hip) area 8 days post operation. n = 5 mice per group, scale bar = 100 µm. In b and d, data are presented as Mean ± SD; ***, P < 0.001; **, P < 0.01; by Student’s t-test

