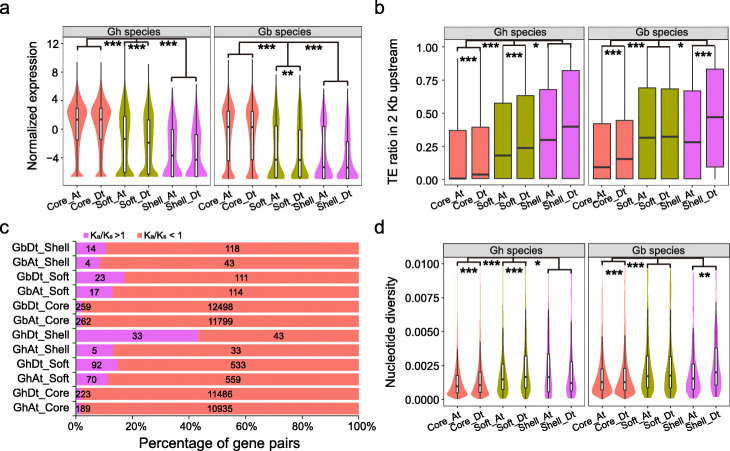
Fig. 4.
Comparison of core and variable genes in A and D subgenomes. a Expression levels of core and variable genes in G. hirsutum and G. barbadense. The softcore genes are represented by “Soft.” b Ratio of transposable element (TE) insertion frequency in upstream 2 kb of core and variable genes in the A and D subgenomes. c Ratio of nonsynonymous/synonymous (Ka/Ks) mutations of core and variable genes. d SNP diversity of core and variable genes. The comparison of gene expression, TE, and SNP diversity between core and variable genes were carried out using a two-sided Kolmogorov-Smirnov test (*P < 0.05, **P < 0.01, ***P < 0.001)

