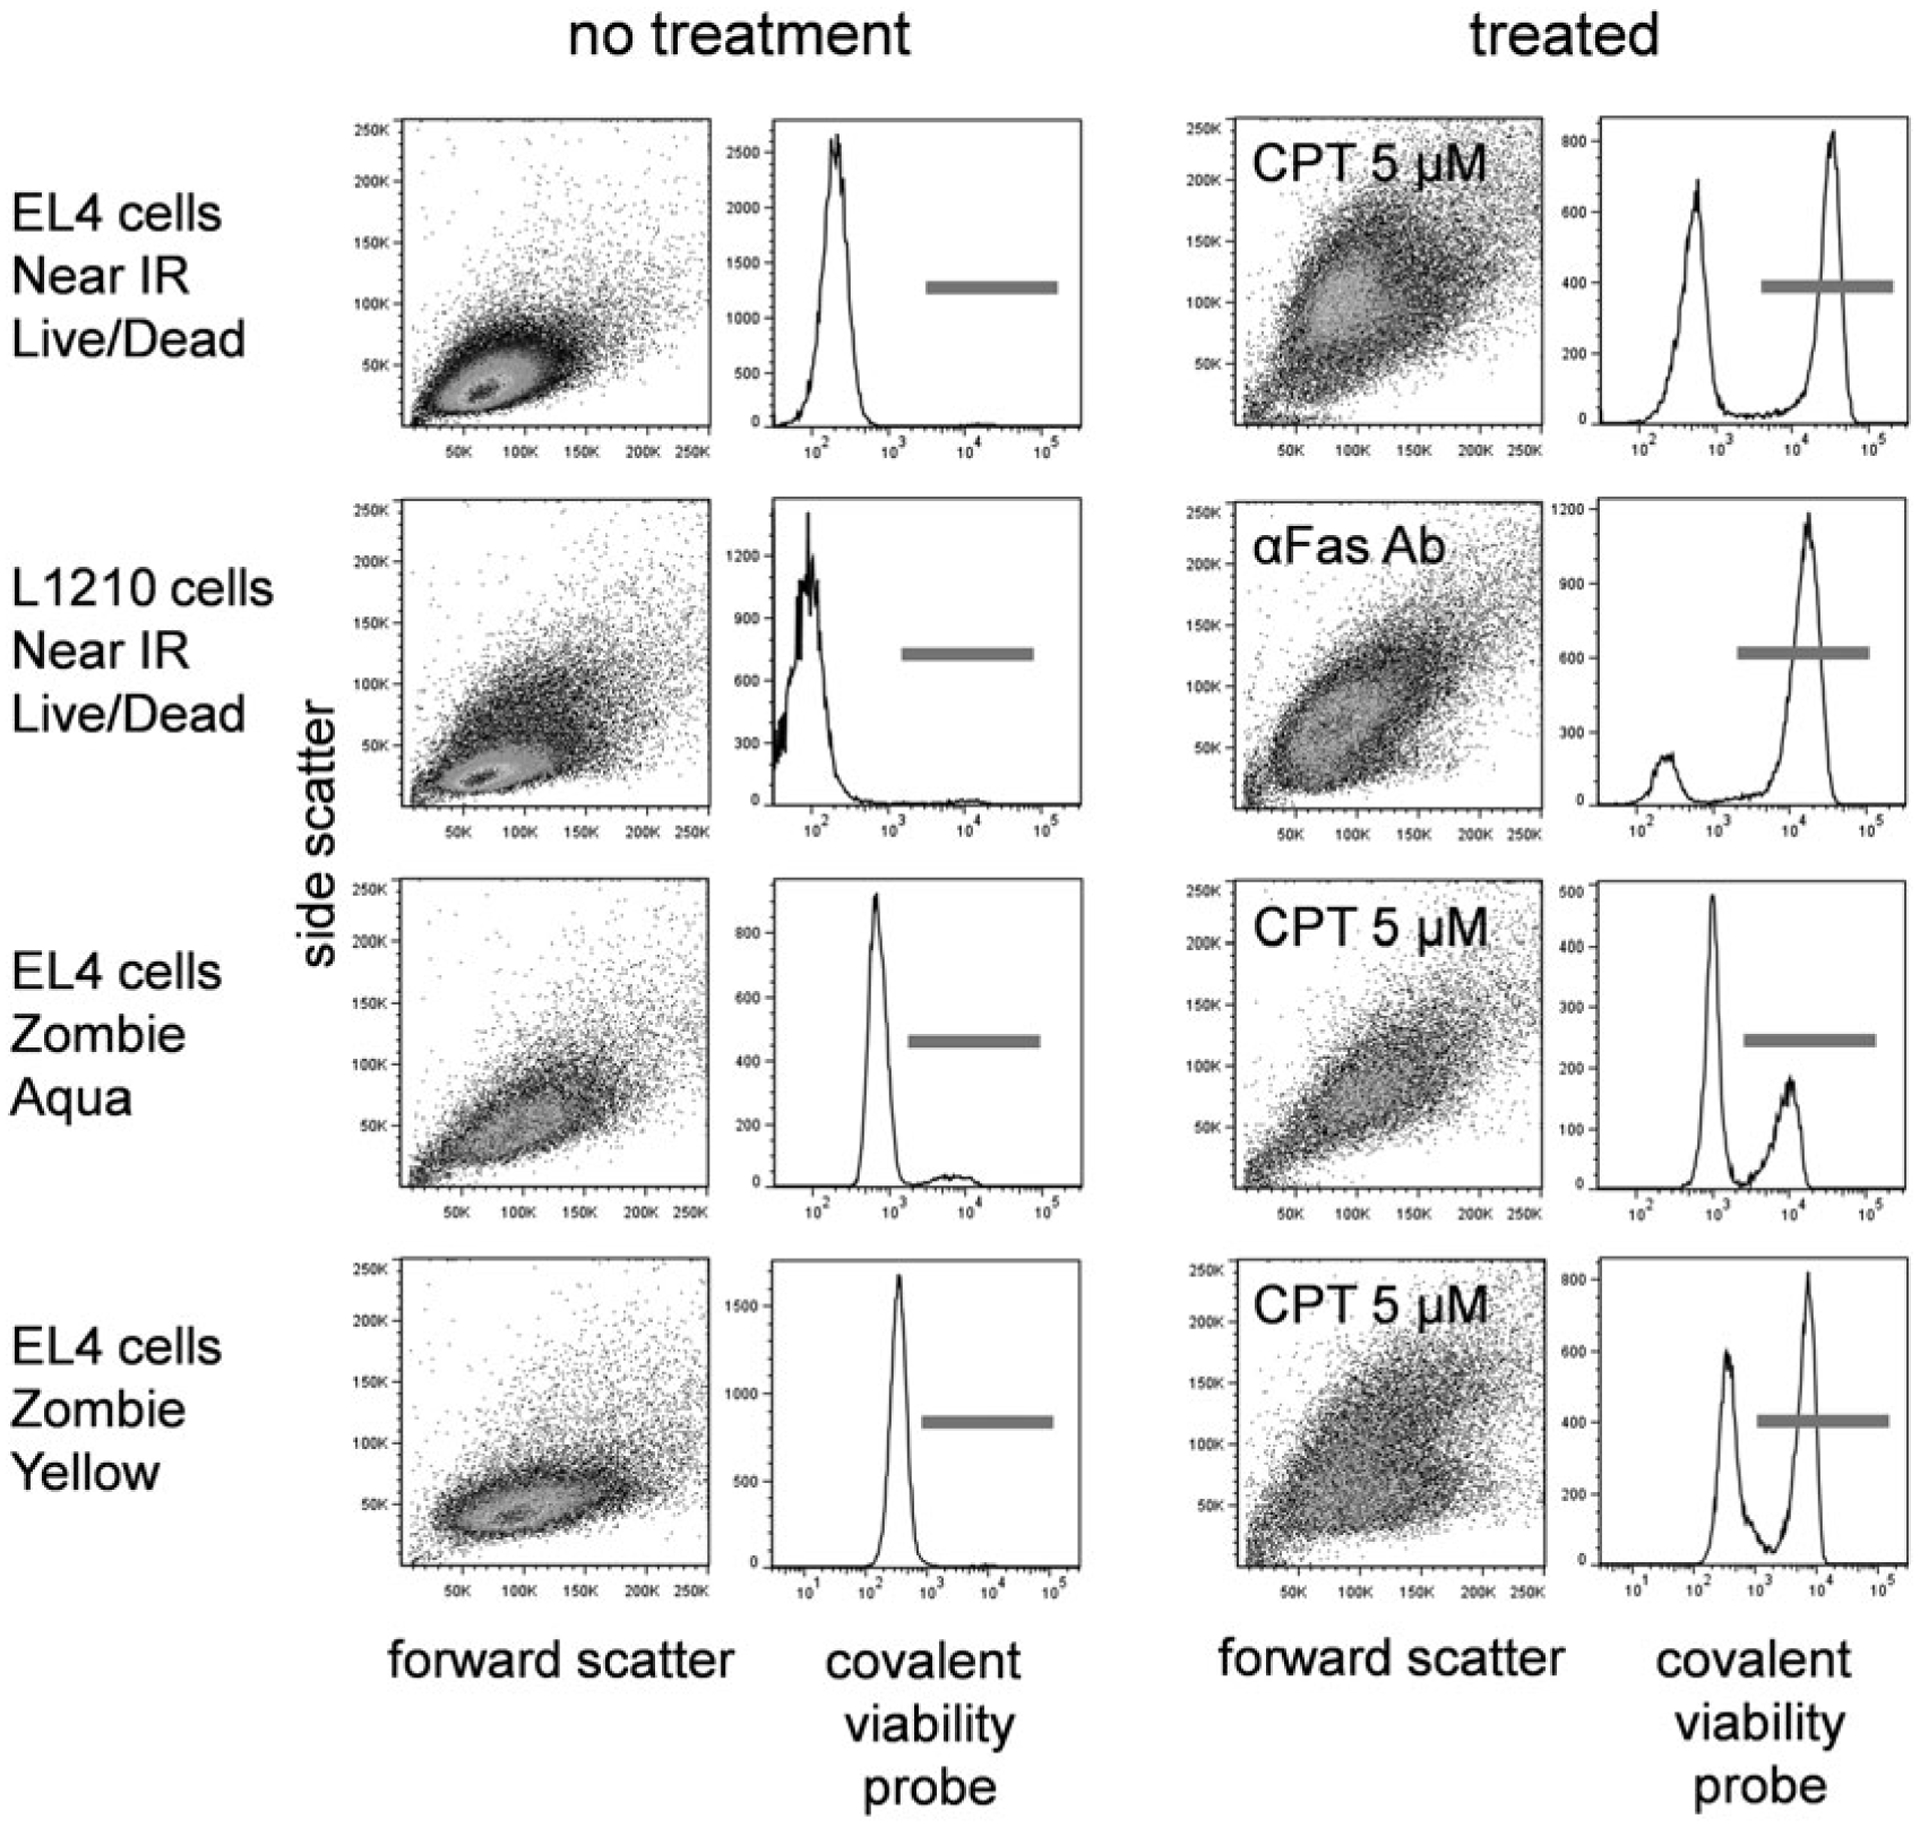
Fig. 4.

Covalent viability probe labeling. EL4 cells treated with camptothecin at 5 μM for 16 h or L1210 cells treated with anti-Fas antibody (clone Jo2) at 1:1000 final concentration for 12 h were labeled with the indicated covalent viability probe. Forward versus side scatter dotplots and viability probe histograms are shown for untreated (left two columns) and treated (right two columns) cells
