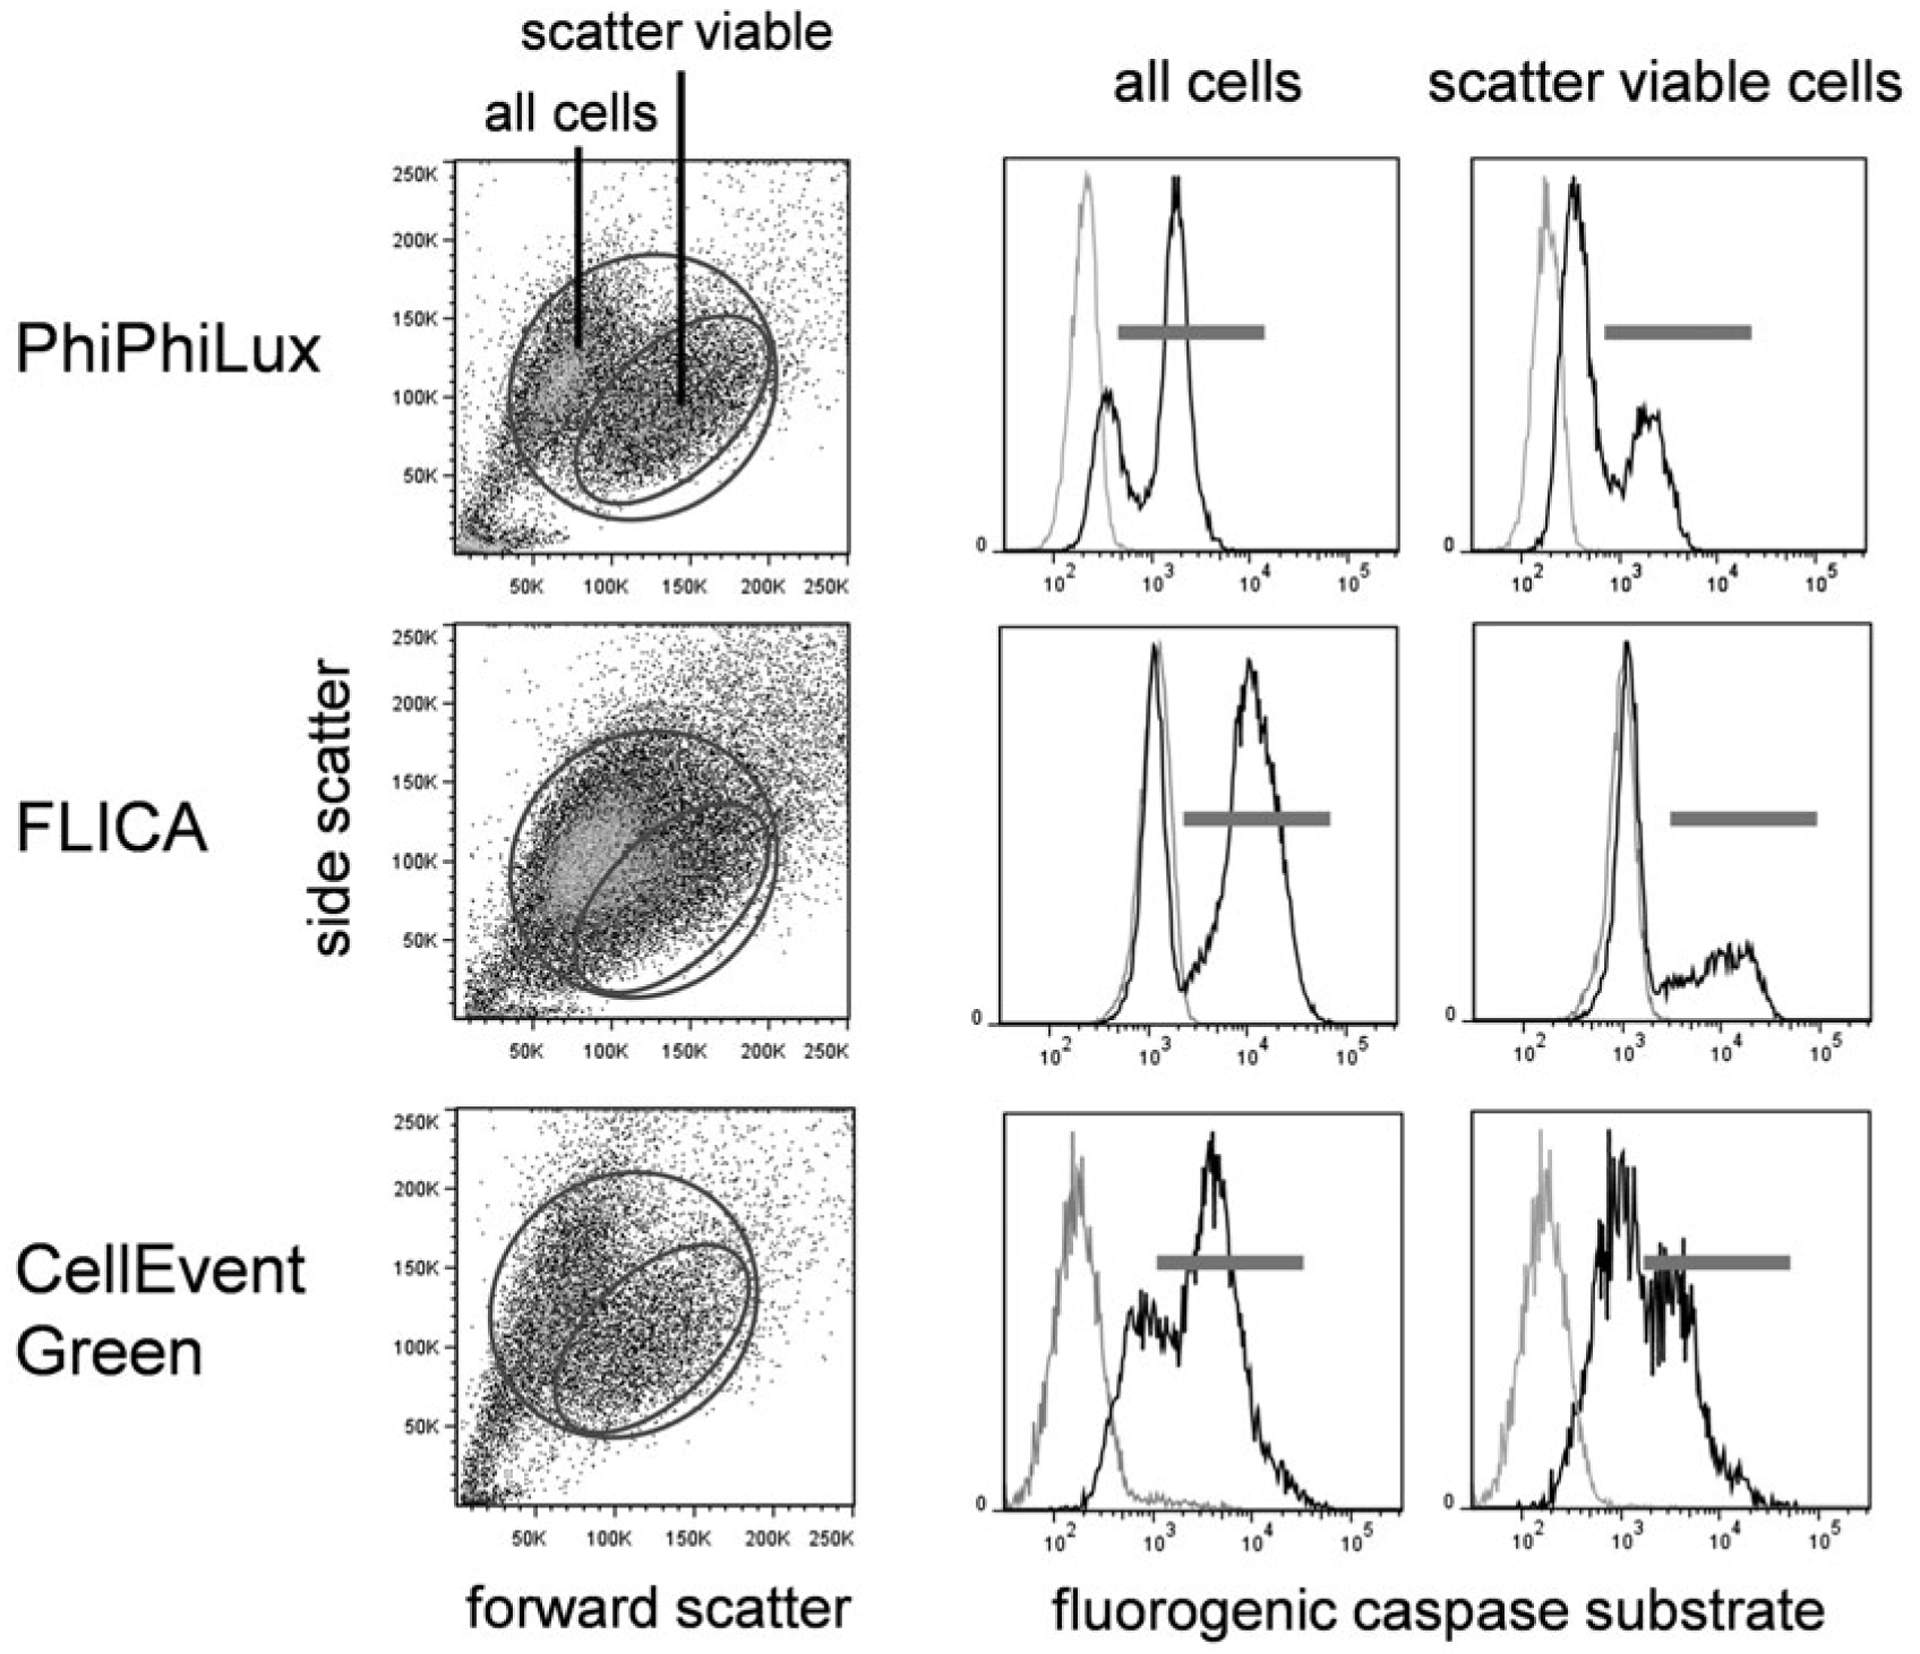
Fig. 5.

Fluorogenic caspase substrate fluorescence in viable and apoptotic cells versus cellular autofluorescence. EL4 cells treated with camptothecin at 5 μM for 16 h were labeled with PhiPhiLux G1D2 (top row), FLICA (middle row), or CellEvent Green (bottom row). Forward versus side scatter dot plots (left column) with corresponding caspase labeling for all cells (middle column) or scatter viable only (right column). In the fluorogenic caspase histograms, black peaks indicate substrate labeling; gray peaks are unlabeled cells
