
Fig. 9.
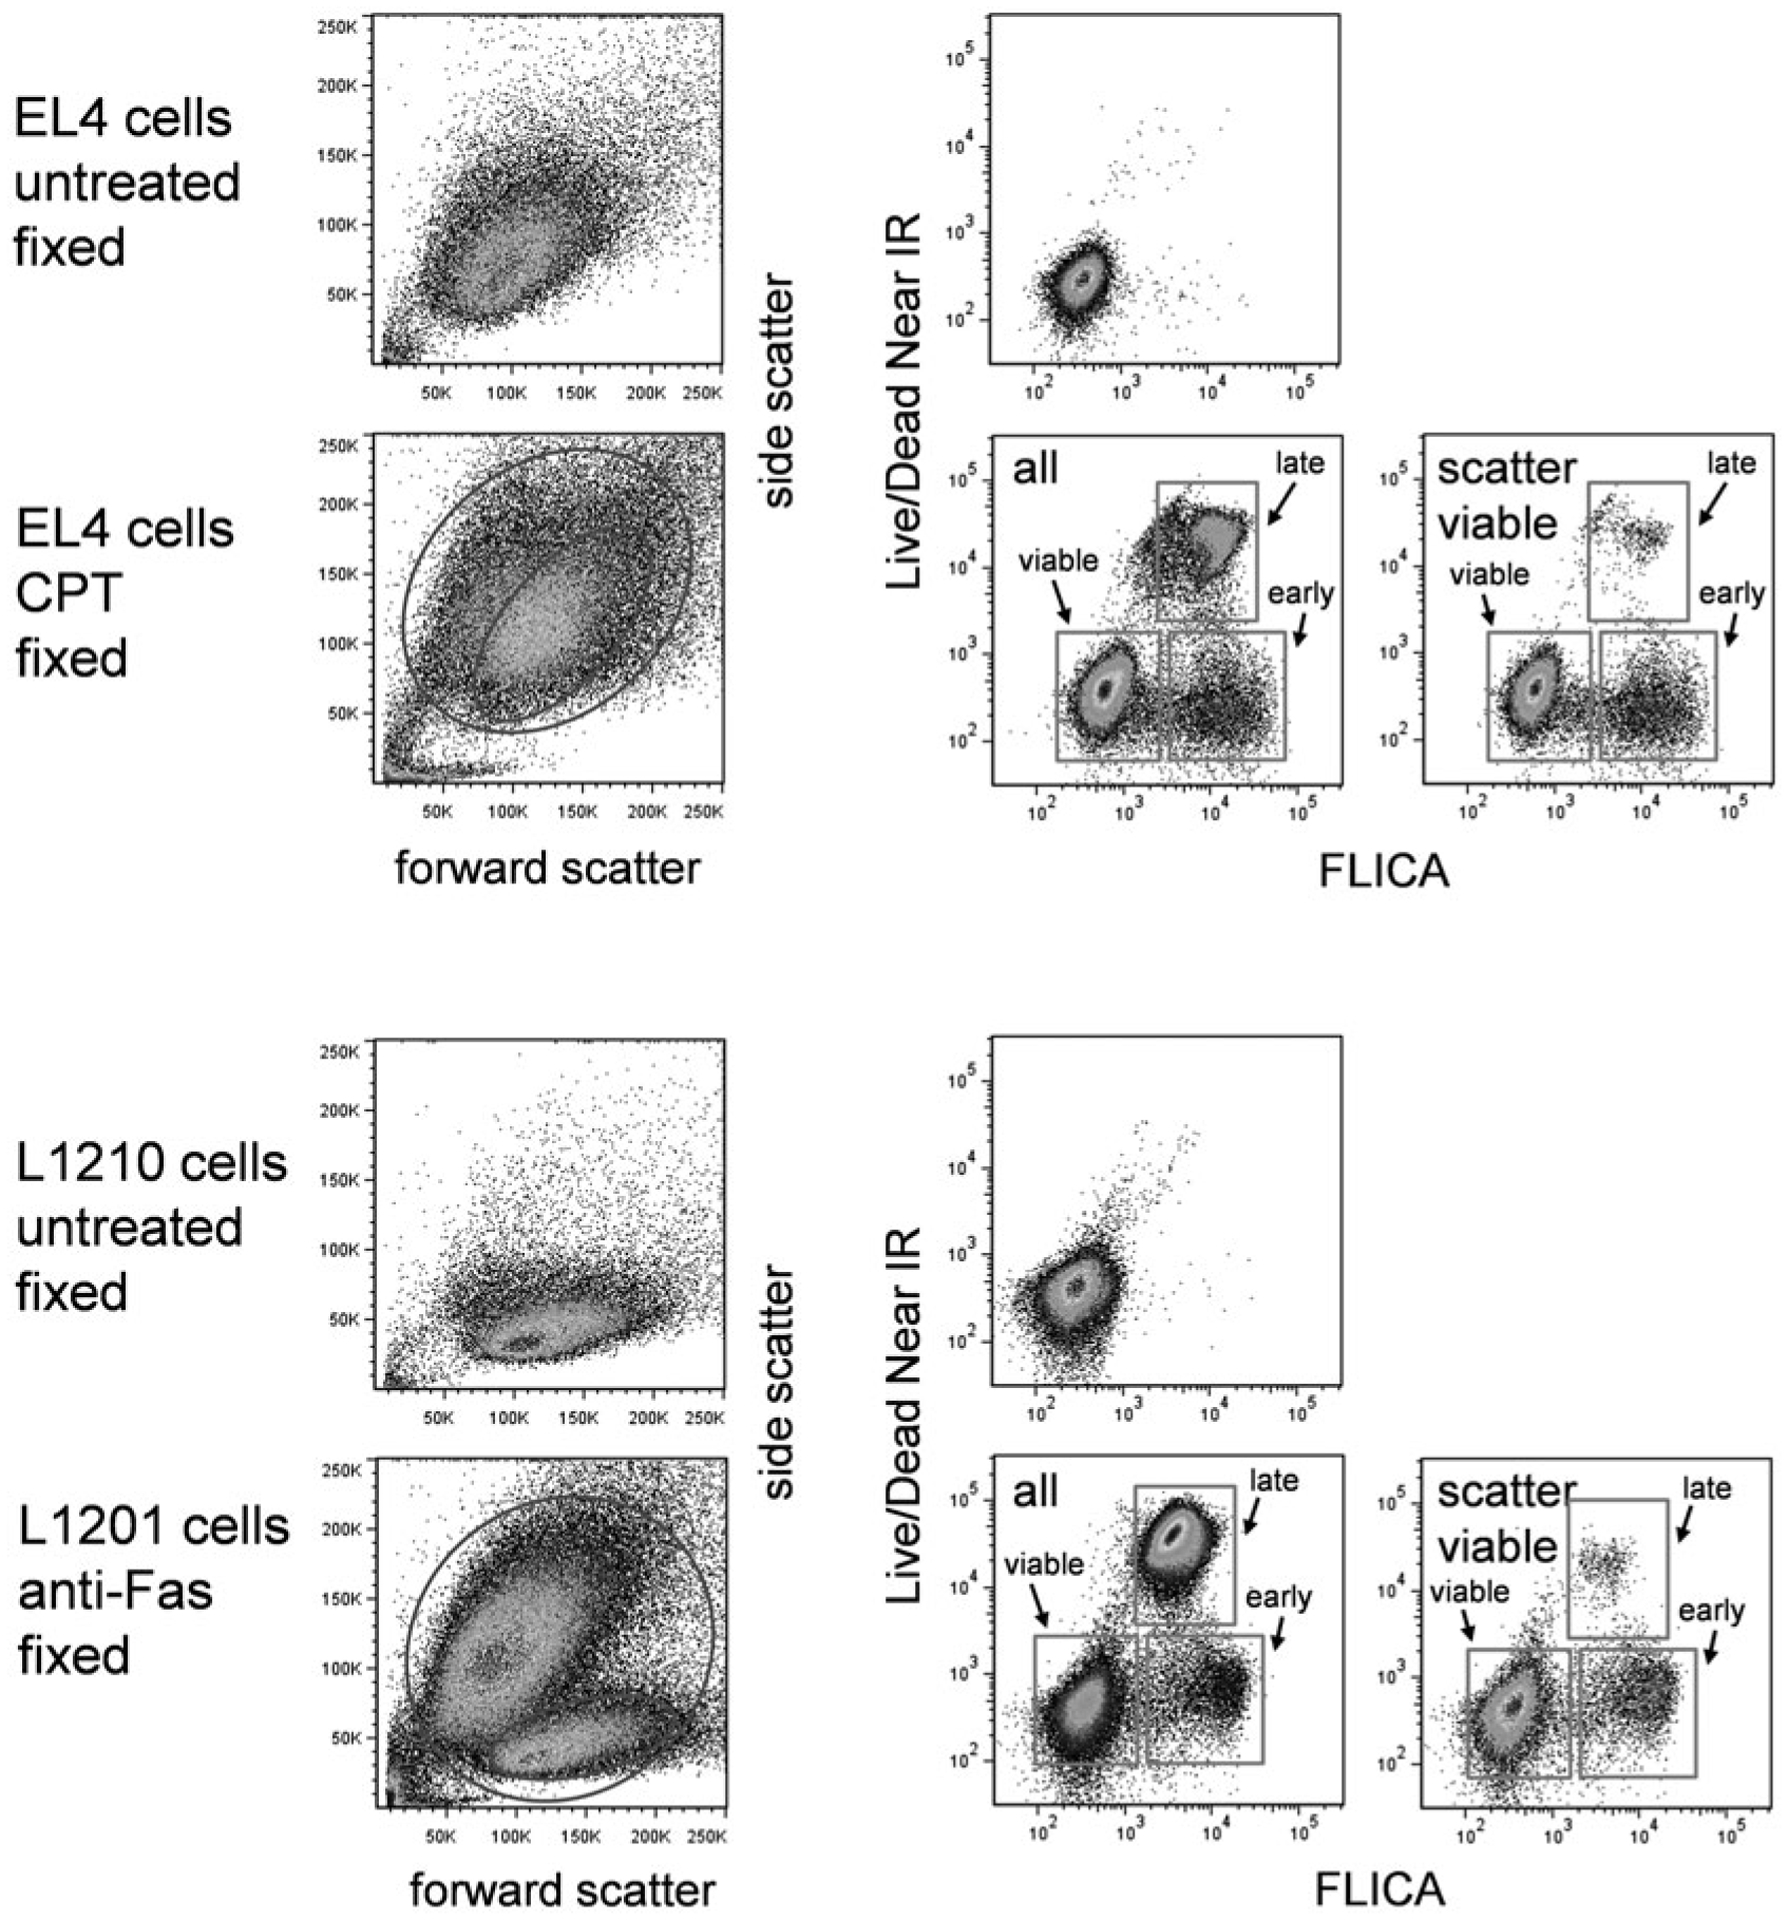
FLICA and covalent viability dye labeling. EL4 cells untreated or treated with camptothecin at 5 μM for 16 h (top two rows) or L1210 cells untreated or treated with anti-Fas antibody (clone Jo2) for 12 h (bottom two rows) were labeled with FLICA and the covalent viability dye Live/Dead Near IR (see Table 1). Scatter dot plots and labeling for both labels in untreated and treated cells are shown. Stages of cell death are indicated