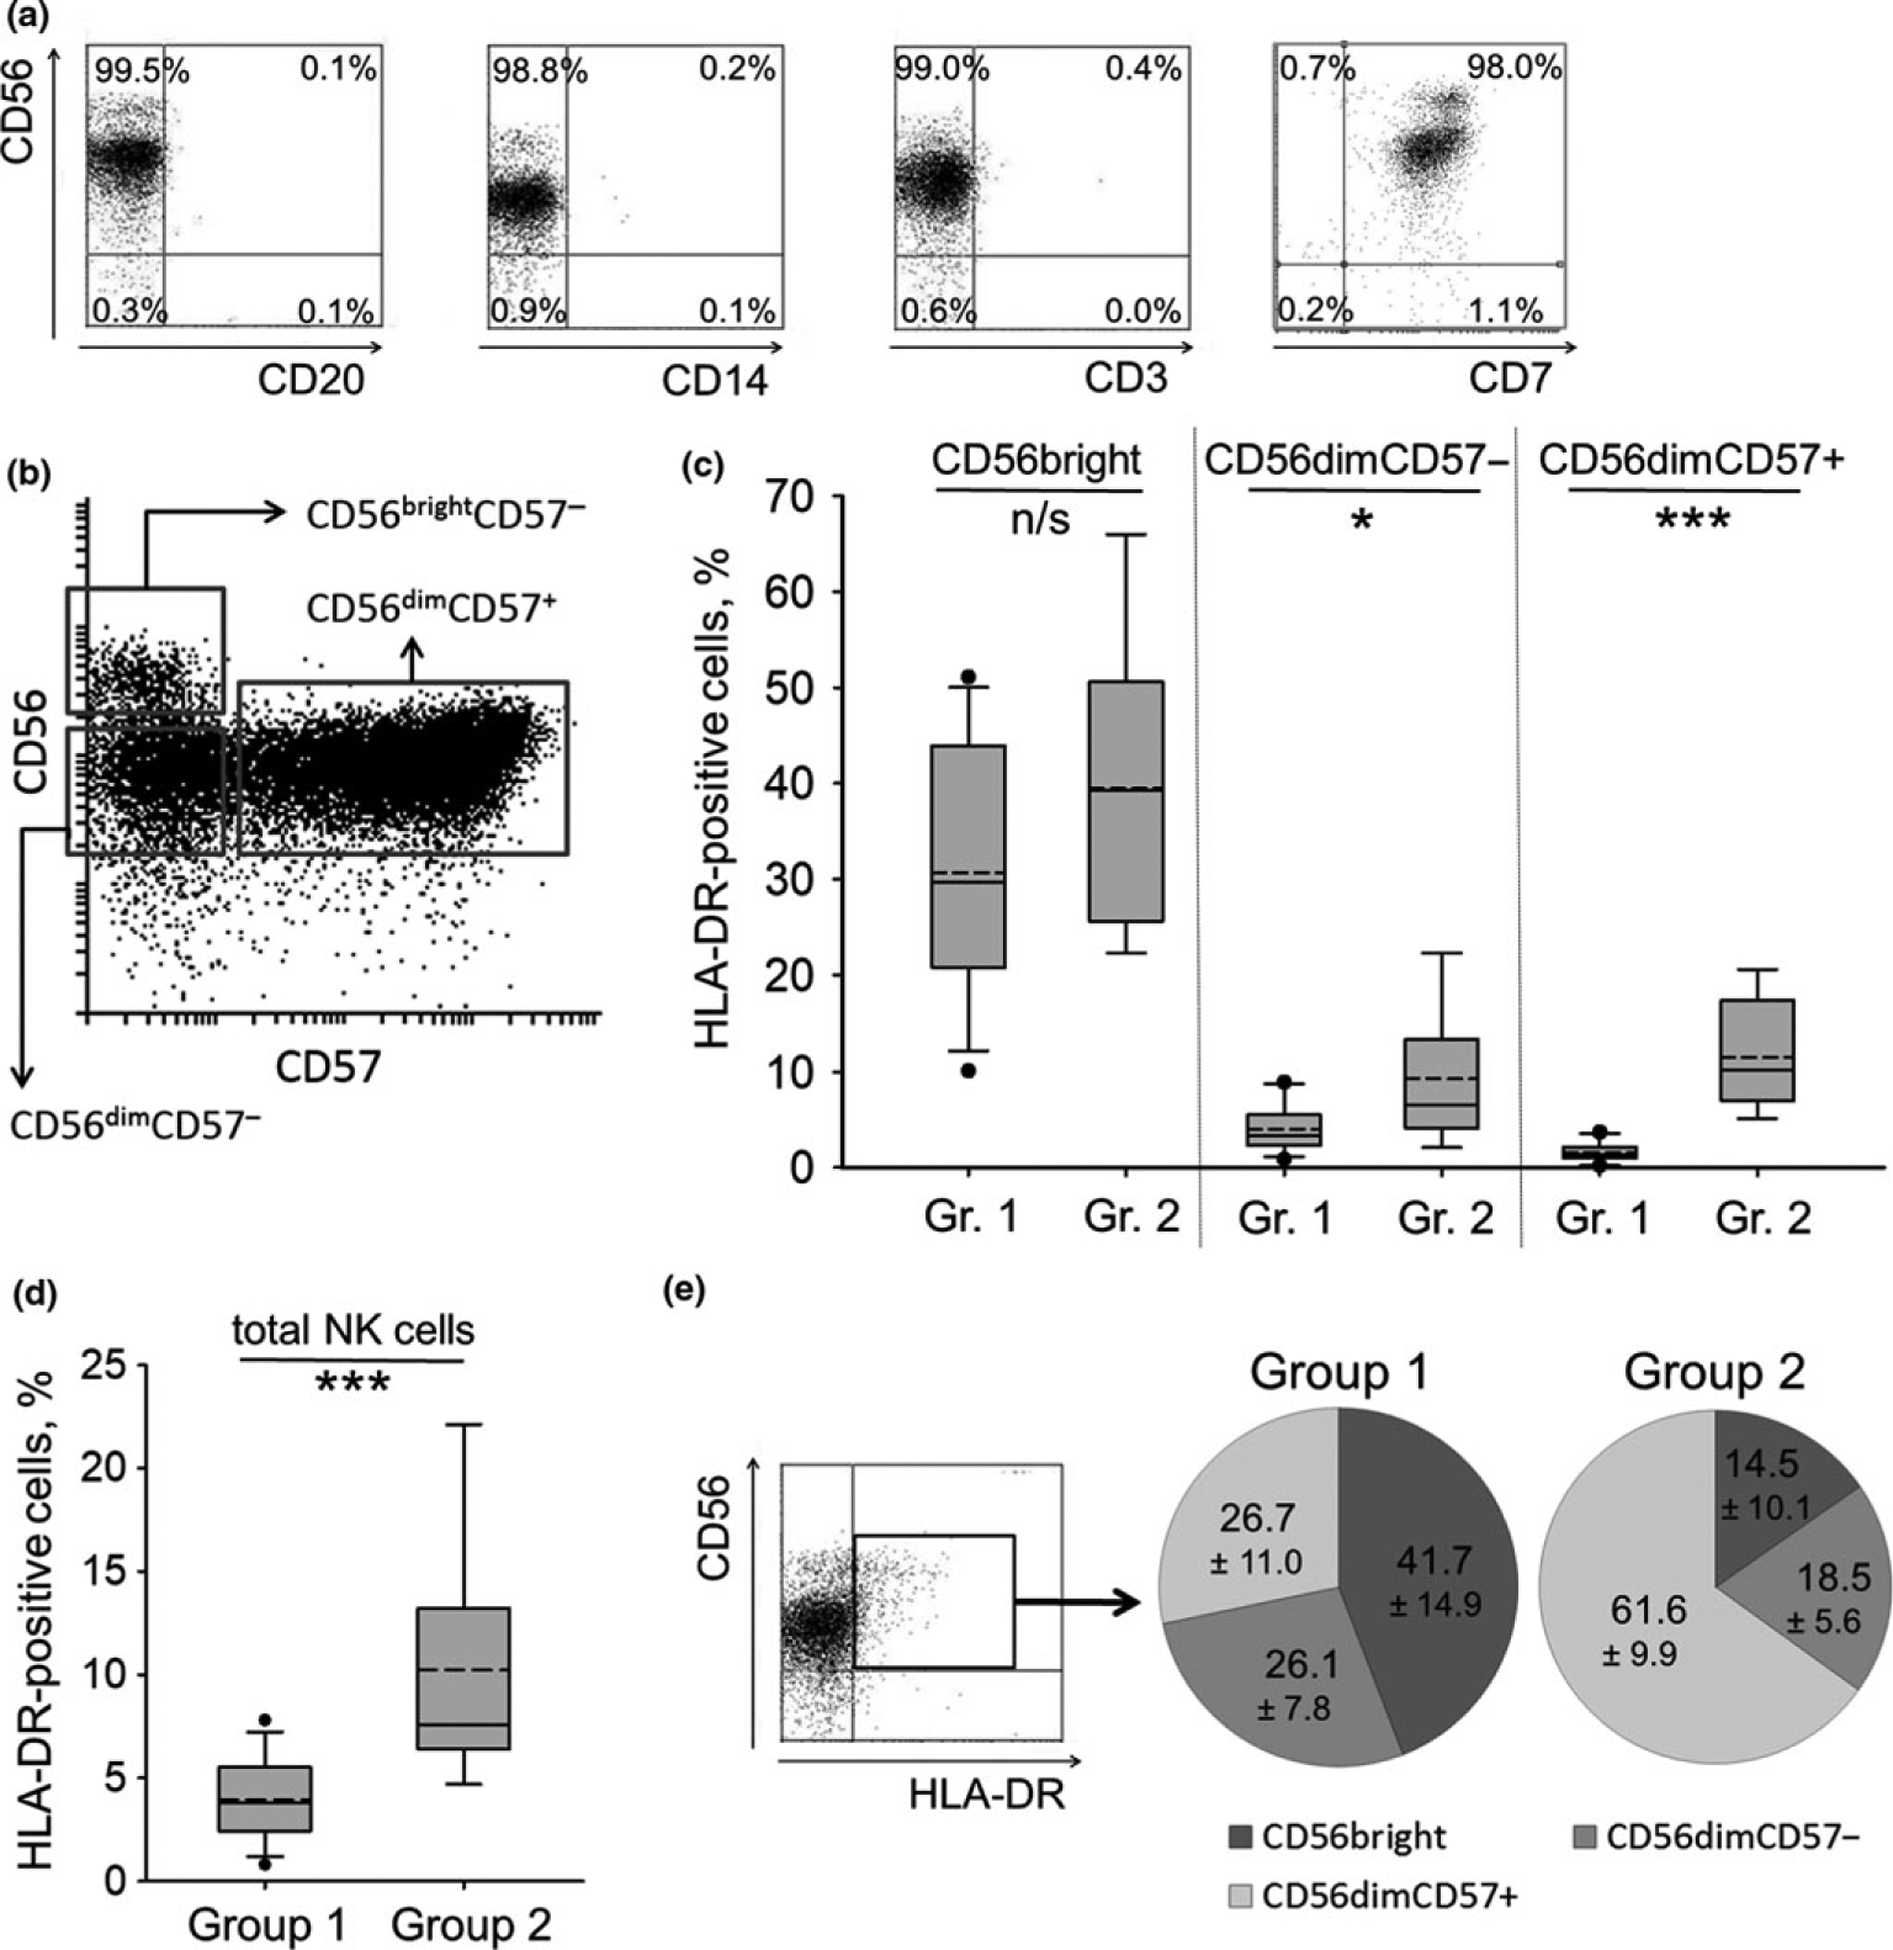
Figure 1.

Analysis of HLA-DR expression in freshly isolated NK cells. (a) NK cell phenotype measured directly after magnetic separation. (b) NK cell subsets, gated to analyze HLA-DR expression, on different stages of differentiation. (a), (b) Representative staining obtained from a single donor out of 21 donors examined is shown. (c, d) Box plots illustrating proportion of HLA-DR-positive cells in CD56bright, CD56dimCD57− and CD56dimCD57+ NK cells (c) and in total NK cells (d) in donors from group 1 and 2. Group 1: proportion of HLA-DR+ cells in CD56dimCD57+ subset is less than 5%; group 2: proportion of HLA-DR+ cells in CD56dimCD57+ subset is more than 5%. Whiskers display the 5th and 95th percentiles, solid line — the median, dashed line — the mean value, black dots — the outliers. Gr. 1 and Gr. 2 stand for group 1 and 2, and comprise 12 and 9 donors, respectively. (e) Proportions of NK cells on different stages of differentiation within HLA-DR-positive subpopulation in donors from group 1 and 2. Mean value ± SD out of 12 and 9 donors examined, respectively, is shown.
