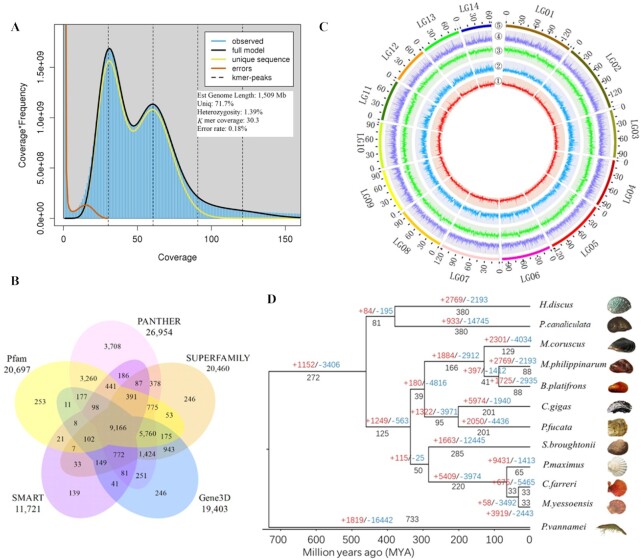
Figure 3:
Annotation and evolution. A. GenomeScope plot of the 51-mer content within the hard-shelled mussel genome. Estimates of genome size and read data are shown. B. Venn diagram indicating the number of genes that were annotated in ≥1 database. C. Genomic landscape of M. coruscus. The chromosomes are labeled as LG01–LG14. From the outer to the inner circle: 5, marker distribution across 14 chromosomes at a megabase scale; 4, gene density across the whole genome; 3, SNP density; 2 and 1, number of repetitive sequences and GC content across the genome, respectively. 1–5 are drawn in non-overlapping 0.1-Mb sliding windows. The length of chromosomes is defined by the scale (Mb) on the outer circles. D. Phylogenetic tree based on protein sequences from 12 metazoan genomes, namely, those of Chlamys farreri (PRJNA185465), Pinctada fucata martensii (GCA_002216045.1), Modiolus philippinarum (GCA_002080025.1), Crassostrea gigas (GCF_000297895.1), Mytilus coruscus, Bathymodiolus platifrons (GCA_002080005.1), Mizuhopecten yessoensis (GCA_002113885.2), Penaeus vannamei (ASM378908v1), Pecten maximus (GCA_902652985.1), Scapharca (Anadara) broughtonii (PRJNA521075), Pomacea canaliculata (PRJNA427478), and Haliotis discus hannai (PRJNA317403).

