Figure 4:

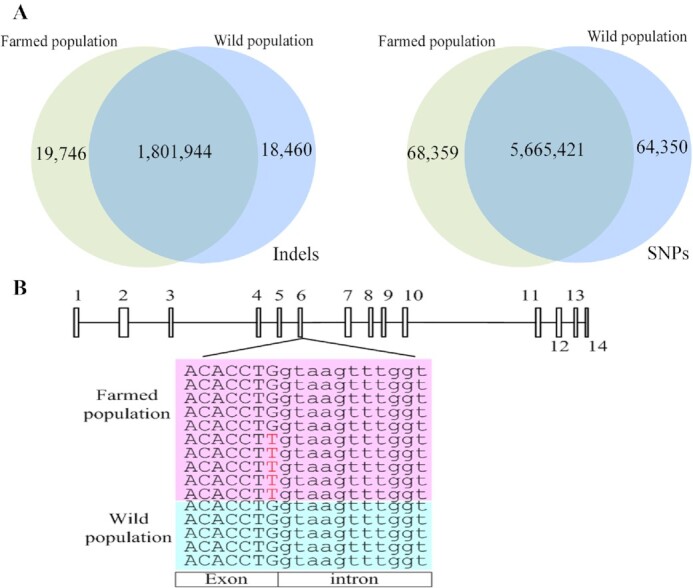
Sequence variations between farmed and wild populations. A. Venn diagrams showing the number and distribution of indels and SNPs between the farmed and wild populations. B. Differences in the number of SNPs on the exons of chitobiase. The rectangles indicate the 14 exons of the chitobiase gene and the lines between the 14 rectangles indicate introns; the pink matrix represents reads from the farmed population, and the blue matrix represents reads from the wild population. Bases denoted by capital letters are located on exons, whereas those denoted by small letters are located on introns.
