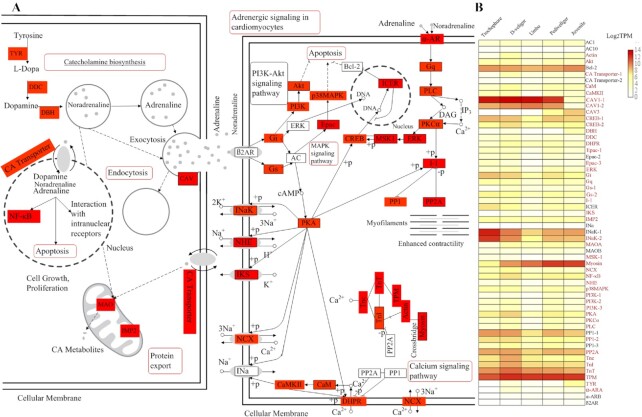
Figure 6:
Spatial and temporal expression of genes involved in development and metamorphosis. A. Expression pattern of genes implied in the pathways of catecholamine biosynthesis and adrenergic signaling in cardiomyocytes, according to KEGG-based annotation. Red rectangles indicate upregulated genes during development, red rectangles with black edge indicate upregulated genes at Pediveliger stage and metamorphosis, and white rectangles denote genes that were identified during KEGG analysis but whose expression did not change. Red bubbles represent the most important pathways in which the upregulated genes are involved. B. Heat map showing the expression levels of all genes involved in the pathways of catecholamine biosynthesis and adrenergic signaling in cardiomyocytes across 5 developmental stages. These quantification results of gene expression are the averages of 3 replicate samples.

