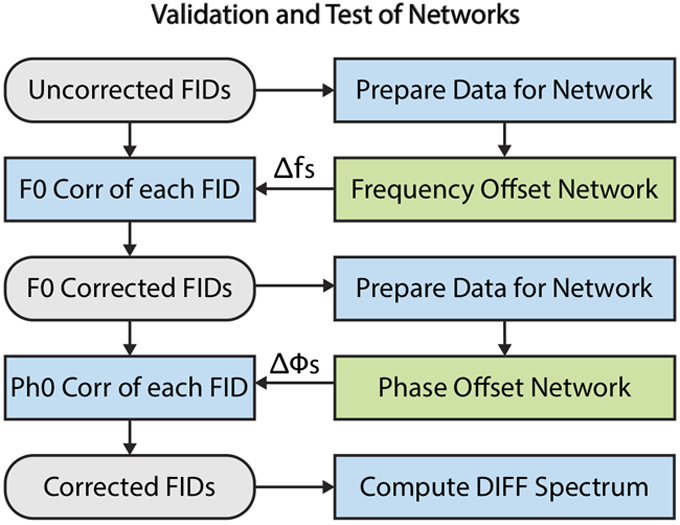
Figure 2.

Workflow illustrating the validation and test of the networks. First, the uncorrected FIDs were prepared (FFT, normalize, crop, magnitude) and input to the frequency offset network. The predicted frequency offset (Δf) was applied to each FID. Second, these frequency-corrected FIDs were then prepared (FFT, normalize, crop, real) and input to the phase offset network. The predicted phase offset (Δϕ) for each FID was subsequently used to phase correct the frequency-corrected FIDs. An average difference spectrum was computed by subtracting the averaged OFF spectrum from the average ON spectrum.
