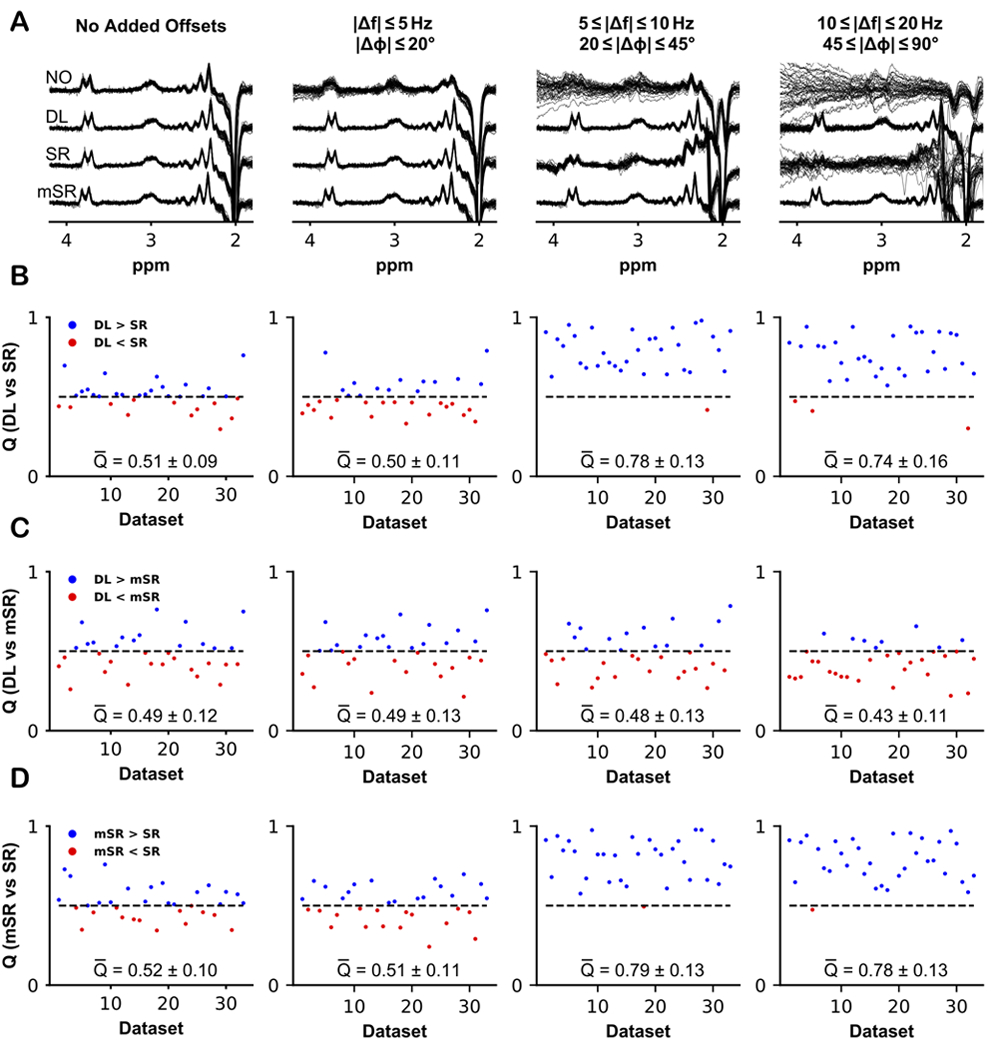
Figure 7.

Difference spectra and performance scores comparing DL to SR, DL to mSR, and mSR to SR, for the 33 in vivo datasets. The difference spectra were either computed without any FPC (NO), using the workflow in Figure 2 (DL), using spectral registration (SR), or using model-based SR (mSR). A) Results of applying corrections to the in vivo data without further manipulation, and with additional frequency and phase offsets applied to the same 33 datasets: small offsets (0–5 Hz; 0–20°); medium offsets (5–10 Hz; 20–45°); and large offsets (10–20 Hz; 45–90°). B) Comparative performance scores Q for DL and SR for each dataset. A score above 0.5 indicated that DL performed better than SR meanwhile a score below 0.5 indicated that SR performed better than DL in terms of alignment. Q-bar indicates the mean Q score ± the standard deviation. C) Comparative Q scores for DL and mSR. D) Comparative Q scores for mSR and SR.
