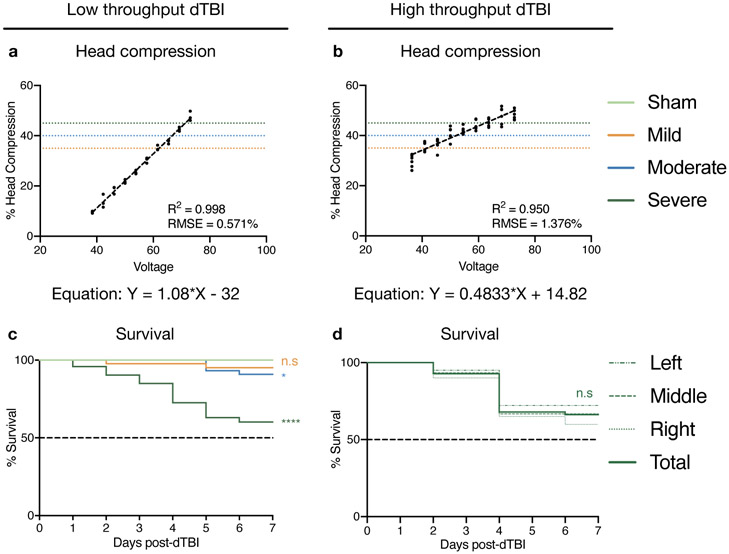
Figure 6. Representative results for low-throughput and high-throughput dTBI devices:
a, b. Graph indicating that head compression increases linearly with increasing voltage for both devices. Dotted lines indicate mild (35%), moderate (40%) and severe (45%) head compression, and the equation of the line is given below. Number of flies: 3 per voltage in the low-throughput device, 6 per voltage in the high-throughput device. c. 7d post-injury survival curve using the low-throughput device for sham, mild, moderate and severe injury indicating the severe and moderate injury are significantly different from sham in this period. Number of animals: 45 for sham, 44 for mild, moderate, 73 for severe injury d. 7d post-injury survival curve using the high-throughput device for severe injury. The different dashed lines indicate position along the collar, with left-most 2 flies being grouped as “Left”, middle 2 flies as “Middle”, and right-most 2 flies as “Right”. Solid line indicates aggregated total of all positions. Number of animals: 60/position. Genotype for all figures: w1118 male. Statistics: c, d. Log rank test comparing each group to sham (c) or total (d) * p< 0.05, **** p<0.0001, n.s Not Significant. Source data for this figure are provided with this paper.

