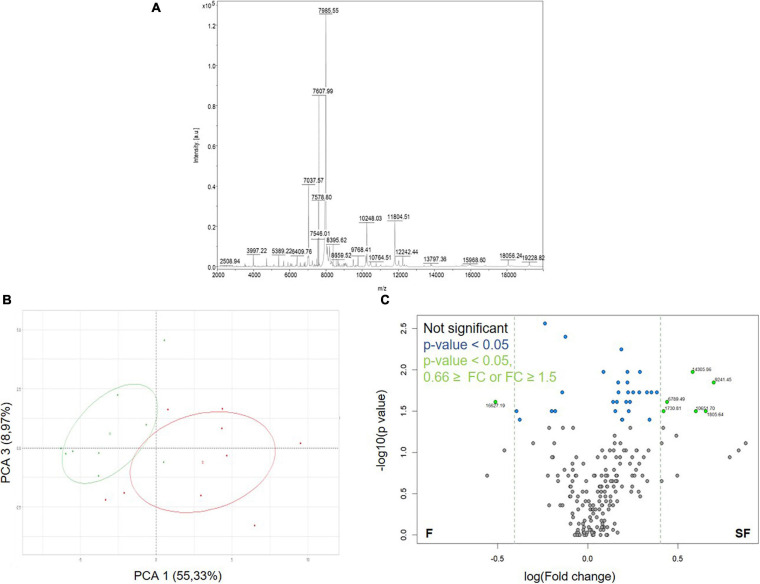
FIGURE 2.
Protein content exploration of sperm from fertile (F) and subfertile (SF) meat-line roosters by ICM-MS. (A) Representative sperm cell ICM-MS spectra from one F animal. (B) Principal component analysis (PCA) of ICM-MS signals obtained for F (in green) and SF (in red) roosters. (C) Volcano plot analysis between F and SF animals of detected m/z peaks (n = 211). Gray points indicate not significant peaks, blue ones, peaks with a significant abundance difference between F and SF animals (p < 0.05), and green ones, the significant peaks presenting a fold change (FC) ≤ 0.66 or ≥ 1.5.

