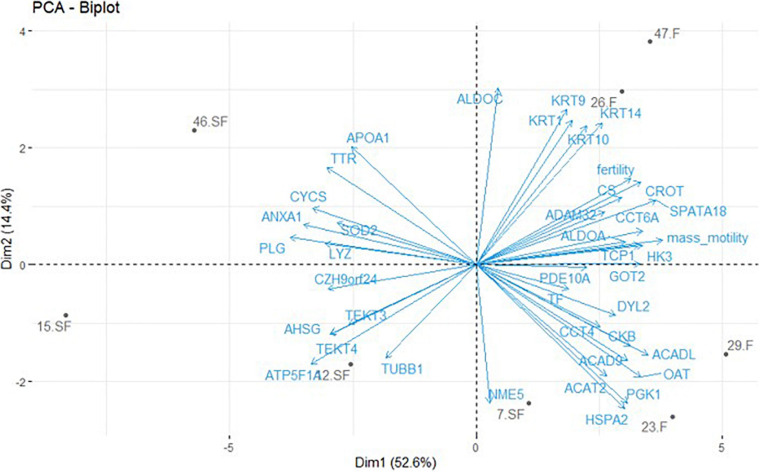
FIGURE 3.
Principal component analysis (PCA) of protein abundances obtained by GeLC-MS/MS with unique gene identification combined with fertility status and semen mass motility. Only DAP with a unique gene and an annotation (exclusion of LOC proteins) were included in this analysis. One significant DAP per cluster was retained and the mean signal calculated based on the three technical replicates obtained for each animal. Animals are revealed by their identification number and their fertility status (F = fertile; SF = subfertile). Animals are represented in gray and protein contribution as well as semen parameters in blue.

