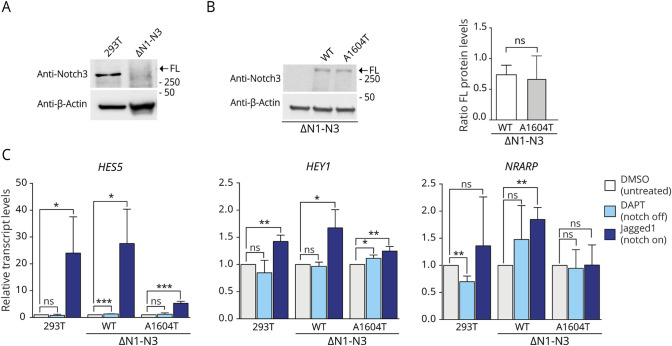
Figure 3. Reduced Activation of Notch Downstream Genes by the NOTCH3A1604T Receptor.
(A) Western blot analysis of the inactivation of NOTCH3 by CRISPR/Cas9 in the 293T(ΔN1-N3) cells (B). Western blot analysis showing the levels of full-length wild-type and A1604T NOTCH3 receptor in the 293T(ΔN1-N3)N3wt (wt) and 293T(ΔN1-N3)N3A1604T (A1604T) cell lines, respectively, compared with 293T(ΔN1-N3) cells as the control (left). β-Actin levels were used as loading controls. The positions of the FL form of the receptor are indicated. On the right: quantification of the full-length receptor in the 293T(ΔN1-N3)N3wt and 293T(ΔN1-N3)N3A1604T cell lines. (C). Analysis of messenger RNA (mRNA) expression from the HES5, HEY1, and NRARP genes in the 293T(ΔN1-N3)N3wt and 293T(ΔN1-N3)N3A1604T cell lines or in 293T cells as the control in response to activation of the wild-type or A1604T NOTCH3 receptor by Jagged1 (Notch on) or block of S3 cleavage by DAPT treatment (Notch off), as indicated. β-Actin levels were used as loading controls, and the positions of the FL form of the receptor are indicated. GAPDH mRNA expression was used for normalization. Values are significant at ***p < 0.001, **p < 0.01, and *p < 0.05. FL = full length.

