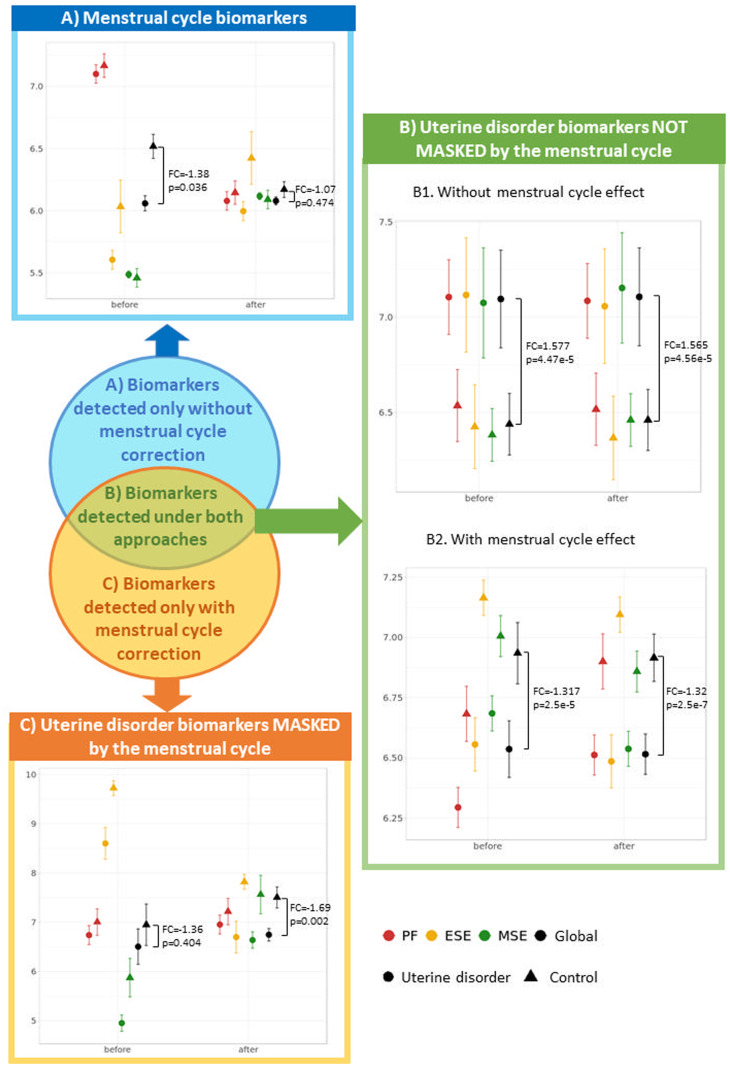
Figure 4.
A new classification of endometrial biomarkers according to their gene expression profiles. For each type of endometrial biomarker (A–C), the average and standard deviation of an example gene is represented before and after menstrual cycle effect correction separated by the uterine disorder (cases and controls) and the menstrual cycle phase. The global measure of cases and controls is also represented together with the correspondent P-values and fold changes (FC) obtained in the differential expression analyses with and without correcting the menstrual cycle. P-values were used instead of FDR as, for each gene, P-value adjustment for multiple testing is dependent on the P-values obtained in the other genes rather than gene-exclusive. (A) Menstrual cycle biomarkers detected only without correction: before the menstrual cycle effect correction, the differences in gene expression among samples from distinct endometrial phases was high and made this gene globally significant (P = 0.036) without being truly affected by the uterine disorder, as the average gene expression of case and control groups was not different within the proliferative and mid-secretory phases. After correcting for the menstrual cycle, the distance between gene expression patterns in different endometrial phases shortened and became non-significant (P = 0.474). Example gene: PPP2R2C from Tamaresis 2014. (B) Uterine disorder biomarkers not masked by the menstrual cycle and detected both before and after the correction: for B1 biomarkers, samples belonging to different phases had similar average expression both before and after applying the menstrual cycle correction, suggesting that expression is not affected by the menstrual cycle and is significantly distinct between cases and controls regardless of whether the correction is applied. In contrast, B2 biomarkers had different average expression between samples collected at different menstrual cycle phases, but the differences between cases and controls were higher, allowing these genes to be also identified as uterine disorder biomarkers before correcting for the effect of the menstrual cycle. Example genes: MYL10 (B1) and SESN1 (B2) from Burney2006. (C) Uterine disorder biomarkers masked by the menstrual cycle and only detected after the correction: Expression differences between menstrual cycle phases are greater than those between cases and controls, making the depicted gene not significant before menstrual cycle correction (P = 0.404). After correcting for the effect of the menstrual cycle, expression differences between menstrual cycle phases are minimised, reducing the variability within case and control groups and making the gene globally significant (P = 0.002). Example gene: CTNNA2 from Burney2006. DEGs, differentially expressed genes. PF, proliferative. ESE, early secretory. MSE, mid-secretory.

