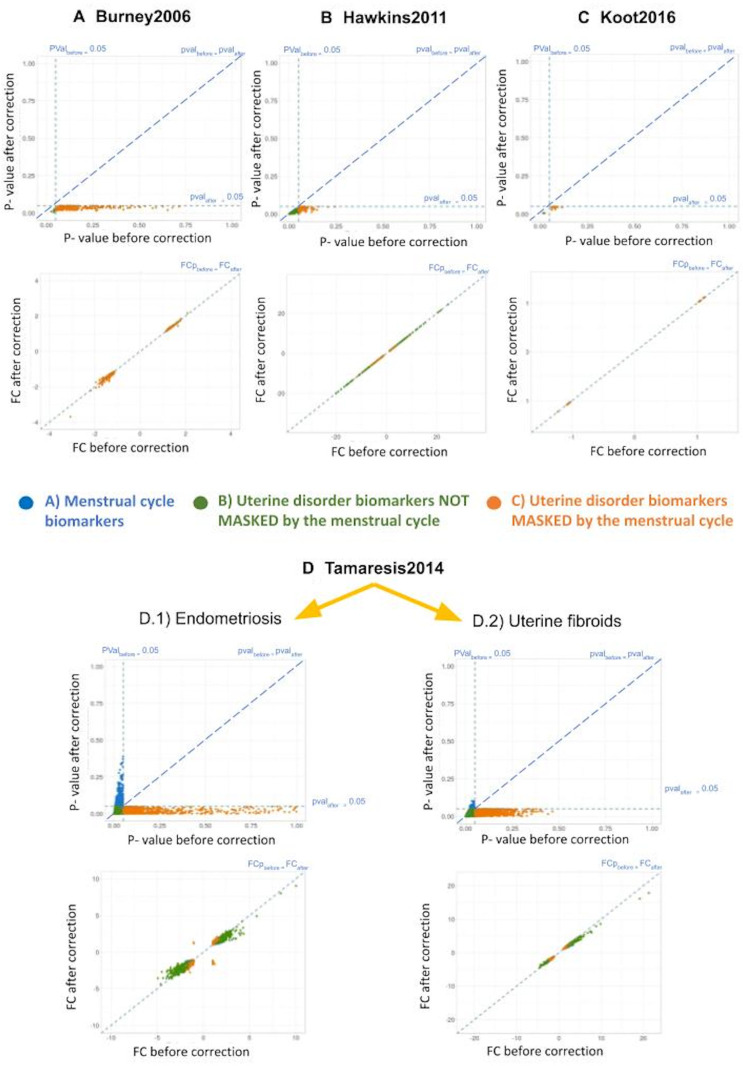
Figure 5.
Changes in P-value and fold change (FC) due to menstrual cycle effect correction on gene expression. For each study (A–D) and type of biomarker (colour code) shown in Fig. 4, P-values (up) and FCs (down) before and after applying the menstrual cycle effect correction method are plotted against each other. Diagonal dotted lines indicate absence of changes in P-values/FCs before and after applying the correction method. Vertical and horizontal dotted lines for P-values represent P-value = 0.05 before and after correcting for the menstrual cycle effect, respectively.

