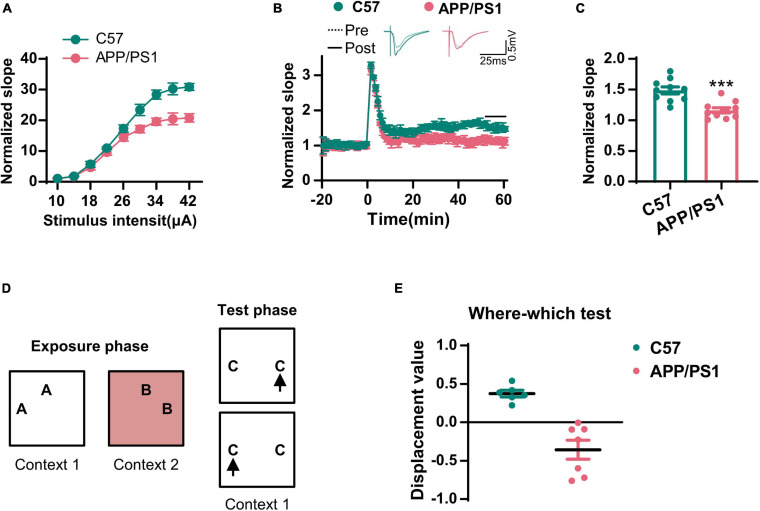
FIGURE 2.
The synaptic transmission and context–place memory were derogated in AD mice. (A) The input–output curve of the CA3–CA1 LTP was shown. (B) The electrophysiological recording to detect the fEPSP slope was used to evaluate the CA3–CA1 LTP. The representative fEPSP traces were shown in the upper panel, and the relative fEPSP slopes were shown in the lower panel. (C) The fEPSP slope of the last 5 min was statistically analyzed. Unpaired Student’s t-test; n = 10 slices from three mice for each group, ***p < 0.001. (D) A schematic diagram of the where–which test was used to examine the context–place memory. (E) The displacement value in the where–which test was evaluated. Unpaired Student’s t-test, n = 6–7 mice for each group, ***p < 0.001.

