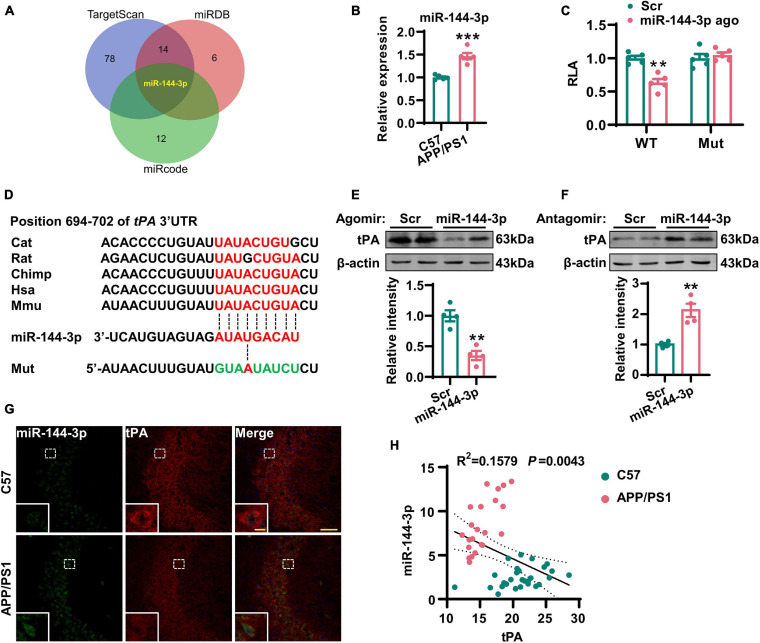
FIGURE 4.
Increased expression of miR-144-3p led to the translational repression of tPA. (A) The miRNAs potentially regulating the tPA translation were shown in a Venn diagram by three different online tools as indicated. (B) The expression profiles of this candidate miRNA in the hippocampi of 12-months-old APP/PS1 mice and C57 mice were evaluated by Q-PCR. Unpaired Student’s t-test was used, n = 5 mice for each group, ***p < 0.001. (C) The wild-type (WT) or mutant (Mut) 3′-UTR of tPA in psiCHECK-2 vector was co-transfected into N2a cells with miR-144-3p agomir or scrambled control (Scr). The luciferase activity was determined at 48 h after the transfection. Multiple t-test adjusted with the Holm–Šidák method, n = 5 for each group, **p < 0.01. (D) Diagram to display the conserved binding site in tPA 3′-UTR to the miR-144-3p. The mutant sequence in 3′-UTR of tPA for luciferase analysis was provided at the bottom. (E) N2a cells were transfected with miR-144-3p agomir or Scr. The cell lysates were collected, and the protein levels of tPA were then detected 48 h later by western blotting. The quantitative analysis was shown in the lower panel. Unpaired Student’s t-test was used, n = 4 for each group, **p < 0.01. (F) N2a cells were transfected with miR-144-3p antagomir (miR-144 anta) or Scr. The protein levels of tPA were detected 48 h later by western blotting. The quantitative analysis was shown in the lower panel. Unpaired Student’s t-test, n = 4 for each group, **p < 0.01. (G) The staining of fluorescence in situ by using the probe of miR-144-3p (green) and immunofluorescence of anti-tPA (red) antibody was performed in the hippocampi of APP/PS1 mice and C57 mice at 12 months. Bar = 50 μm. The representative image of an amplified neuron was shown in the southwest corner. Bar = 5 μm. (H) The correlation analysis between the intensities of miR-144-3p and tPA in (G). n = 22 or 28 from the APP/PS1 mice or C57 mice.

