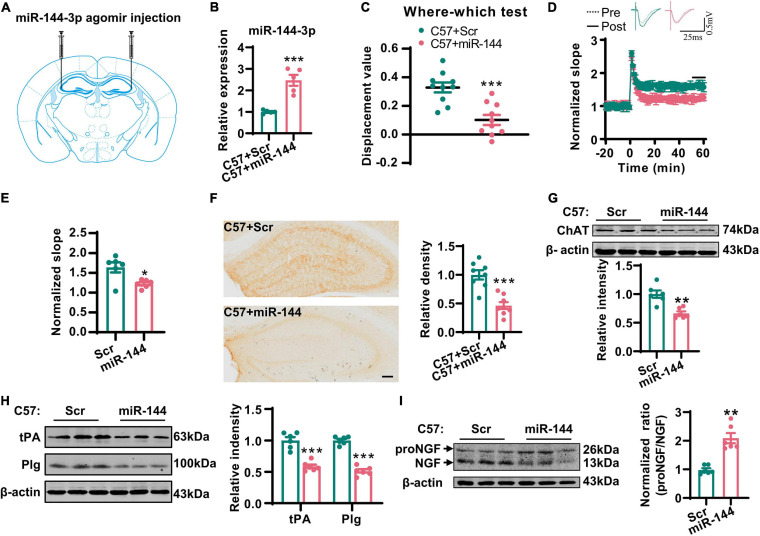
FIGURE 5.
Overexpression of miR-144-3p induced cholinergic degeneration and synaptic/memory impairments. (A) The diagram for the stereotactic injection experiment was shown. (B) The expression of miR-144-3p was evaluated in 3-months-old C57 mice after injection of miR-144-3p agomir 2 weeks later. Unpaired Student’s t-test, n = 5 mice for each group, **p < 0.01. (C) The where–which test was used to assess the context memory after administration of miR-144-3p agomir. Unpaired Student’s t-test, n = 10 mice for each group, ***p < 0.001. (D) The electrophysiological recording to detect the fEPSP slope was used to evaluate CA3–CA1 LTP after administration of miR-144-3p agomir. The representative fEPSP traces were shown in the upper panel, and the relative fEPSP slopes were shown in the lower panel. n = 4–6 slices from three mice for each group. (E) The fEPSP slope of the last 5 min was statistically analyzed. Unpaired Student’s t-test, n = 6 from three mice for each group, *p < 0.05. (F) Representative immunohistochemical images in the hippocampi in C57 mice with miR-144-3p agomir treatment. And the quantitative analysis was shown in the right panel. Bar = 100 μm. Unpaired Student’s t-test, n = 8 from four mice for each group, ***p < 0.001. (G) Hippocampal tissue lysates from the mice above were collected, and the protein level of ChAT was detected by western blotting. Unpaired Student’s t-test, n = 6 mice for each group, **p < 0.01. (H) The protein levels of tPA and Plg were also detected in those mice by western blotting, and the quantitative analysis was shown in the right panel. Unpaired Student’s t-test, n = 6 mice for each group, ***p < 0.001. (I) The protein level of NGF was examined by western blotting in the left panel, and the normalized proNGF/NGF ratio was shown in the right panel. Unpaired Student’s t-test, n = 6 mice for each group, **p < 0.01.

