FIGURE 6.
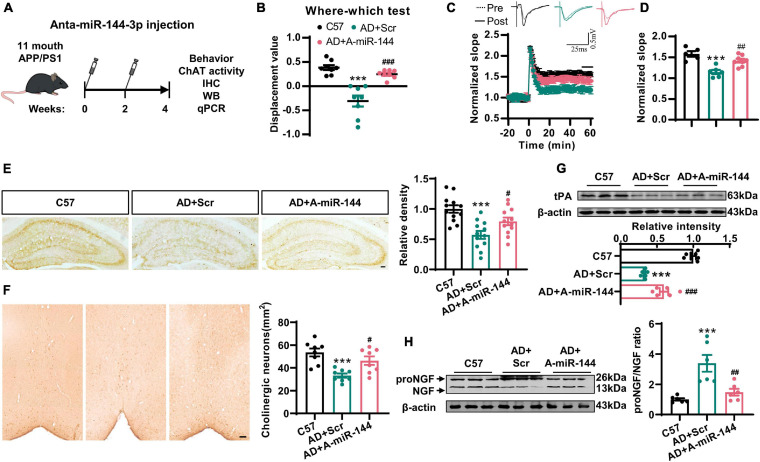
The inhibition of miR-144-3p rescued cholinergic degeneration and synaptic/memory impairments in APP/PS1 mice. (A) The flow diagram of administration of miR-144-3p antagomir. The miR-144-3p antagomir was injected into the hippocampal CA3 of 11-months-old APP/PS1 mice that were used for subsequent experiments. (B) The where–which test was used to assess the context memory in C57, APP/PS1 + Scr (AD + Scr) and APP/PS1 + A-miR-144 (AD + A-miR-144) groups. Ordinary one-way ANOVA with Tukey’s multiple comparisons, n = 8 mice for each group, ***p < 0.001 for AD + Scr vs. C57 and ###p < 0.001 for AD + A-miR-144 vs. AD + Scr. (C) The electrophysiological recording to detect the fEPSP slope was used to evaluate the CA3–CA1 LTP of those three groups. The representative fEPSP traces were shown in the upper panel, and the relative fEPSP slopes were shown in the lower panel. n = 5–8 slices from three mice for each group. (D) The fEPSP slope of the last 5 min was statistically analyzed. n = 5–8 from three mice for each group, ***p < 0.001 for AD + Scr vs. C57 and ##p < 0.01 for AD + A-miR-144 vs. AD + Scr. (E) Representative immunohistochemical images in the hippocampi from mice in those three groups were shown in the left panel, and the quantitative analysis was shown in the right panel. Bar = 100 μm. Ordinary one-way ANOVA with Tukey’s multiple comparisons, n = 12 from four mice for each group, ***p < 0.001 for AD + Scr vs. C57 and #p < 0.05 for AD + A-miR-144 vs. AD + Scr. (F) Representative immunohistochemical images of ChAT-positive neurons in the basal nucleus of Meynert were shown. Bar = 100 μm. The quantitative analysis was indicated in the right panel. Ordinary one-way ANOVA with Tukey’s multiple comparisons, n = 8 from four mice for each group, ***p < 0.001 for AD + Scr vs. C57 and #p < 0.05 for AD + A-miR-144 vs. AD + Scr. (G) The protein level of tPA was detected in those mice by western blotting, and the quantitative analysis was shown. Ordinary one-way ANOVA with Tukey’s multiple comparisons, n = 6 mice for each group, ***p < 0.001 for AD + Scr vs. C57 and ###p < 0.001 for AD + A-miR-144 vs. AD + Scr. (H) The protein level of tPA was detected in the left panel, and the quantitative analysis was shown in the right panel. Ordinary one-way ANOVA with Tukey’s multiple comparisons, n = 6 mice for each group, ***p < 0.001 for AD + Scr vs. C57 and ##p < 0.01 for AD + A-miR-144 vs. AD + Scr.

