

Abstract
Ion mobility-mass spectrometry has emerged as a powerful tool for interrogating a wide variety of chemical systems. Collision-induced unfolding (CIU), typically performed in time-of-flight instruments, has been utilized to obtain valuable qualitative insight into protein structure and illuminate subtle differences between related species. CIU experiments can be performed relatively quickly, but unfolding energy information obtained from them has not yet been interpreted quantitatively. While several methods can determine quantitative dissociation energetics for small molecules, clusters, and peptides, these methods have rarely been applied to proteins, and never to study unfolding. Here, we present a method to rapidly determine activation energies for protein unfolding and dissociation, built on a model for energy deposition during collisional activation. The method is validated by comparing activation energies for dissociation of three complexes with those obtained using Blackbody Infrared Radiative Dissociation (BIRD); values from the two methods are in agreement. Several protein monomers were unfolded using CIU, including multiple charge states of both cations and anions, and activation energies determined. ΔH‡ and ΔS‡ values are found to be correlated, leading to ΔG‡ values that lie within a narrow range (~70–80 kJ/mol) and vary more with charge state than with protein identity. ΔG‡ is anticorrelated with charge density, highlighting the key role of Coulombic repulsion in gas-phase unfolding. Measured ΔG‡ values are similar to those computed for proton transfer within small peptides, suggesting that proton transfer is the rate-limiting step in gas-phase unfolding and providing evidence of a link between the Mobile Proton model and CIU.
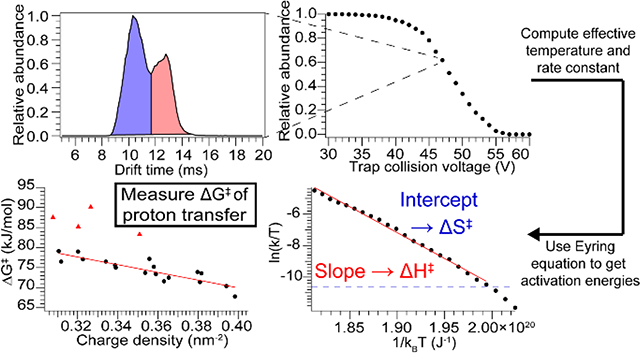
Graphical Abstract
Introduction
The ability of electrospray ionization (ESI) to gently transfer folded proteins to the gas phase and preserve native-like structure and non-covalent interactions, in conjunction with global size measurement using ion mobility (IM), has led to the emergence of native ion mobility-mass spectrometry (IM-MS) as an important structural biology tool.1 Particularly, perturbation of protein or complex structure via gas-phase activation followed by IM-MS analysis has led to valuable insights in an ever-growing number of cases,2–6 such as recent experiments using IM-MS to identify specific membrane protein-lipid interactions.7
One of the most common methods for interrogating protein structure in the gas phase is collision-induced dissociation/collision-induced unfolding (CID/CIU). While CID can be performed on many types of mass spectrometers, CIU is typically undertaken in an ion mobility-time-of-flight mass spectrometer. In both CID and CIU, protein ions accelerated to a high initial kinetic energy experience many (hundreds to thousands for proteins) collisions with neutral gas atoms or molecules that slowly heat the ions, leading to dissociation (CID) or unfolding (CIU) of a portion of the protein or assembly. CID of protein complexes can provide information about the identity of subunits and overall complex stoichiometry.8 Pioneering work by the Ruotolo group has shown that CIU can reveal details of protein structure,9 including the number of domains,10 disulfide binding patterns,11 and location and cooperativity of ligand binding sites.12 However, the relationship between the initial kinetic energy and quantitative parameters such as the activation energy of dissociation/unfolding has not yet been established. This has limited comparisons between both gas-phase energies for different species and gas- and solution-phase energetics. Also unknown at this stage are the exact unfolded structures, any common features of unfolded structures arising from different compact structures, and the pathway(s) by which they are reached.
Activation energies for the dissociation of many peptide and small protein ions can be accurately and precisely determined in the gas phase using blackbody infrared radiative dissociation (BIRD).13–15 In BIRD, implemented in an FT-ICR, ions in an ultrahigh vacuum environment are heated by absorption of blackbody photons emitted from the walls of the ICR cell, which is equilibrated to a specific temperature. The abundance of fragment ions can be measured at a set of reaction times to determine the rate constant at a given temperature. Repeating at multiple temperatures allows the activation energy to be determined using the Arrhenius equation. However, measuring ion unfolding energetics with BIRD is extremely challenging, because it is difficult to measure the ion shape and size distribution after activation in an FT-ICR cell. Additionally, the amount of time required to equilibrate the temperature of the FT-ICR cell between measurements can be many minutes, and, depending on the size of the molecule in question, master-equation modeling may be needed to extract accurate and precise thermodynamic information.16
Various other methods have been used to determine quantitative gas-phase energetic information, including single-collision threshold CID,17,18 calibration using a range of “thermometer” ions such as metal carbonyls,19 hydrated metal ions,20,21 aromatic species,22–24 and small peptides,25,26 multiple-collision CID,27–29 and surface-induced dissociation (SID).28,30,31 Many of these methods, particularly the latter two, require quantum mechanical computation of accurate vibrational levels, which are used in microcanonical Rice-Ramsperger-Kessel-Marcus (RRKM) modeling to determine absolute dissociation energies from experimental data.27–29 Energetic information obtained using the methods described above has provided fundamental insights into ionization,22,23,32 activation,20,21,27 and dissociation properties,25,31,33 as well as structural information.14,34,35 Although these approaches have proven fruitful for the study of small peptides, they have not yet been applied to proteins due to the difficulty of the computations involved. Development of a rapid method that allows determination of absolute energies for protein unfolding and dissociation without requiring an FT-ICR or quantum mechanical calculations would open a critical class of biomolecules to more fundamental study.
Here, we present a method for determining activation energies for protein unfolding and complex dissociation from CIU and CID experiments performed on a Waters Synapt G2-Si Q-IM-ToF mass spectrometer. Using a previously-developed model for energy deposition in collisional activation36 to calibrate the internal temperature enables the activation energy to be determined using either the Arrhenius or Eyring equation and pseudo-first-order reaction kinetics. Activation energies determined for heme loss from myoglobin and subunit dissociation from streptavidin and Shiga toxin 1 are in good agreement with values from BIRD experiments, validating our model. Also reported is the first gas-phase determination of unfolding activation energies for several monomeric proteins. Average ΔG‡ values fall within a narrow range for a variety of proteins and charge states, depend more strongly on charge density than on protein identity, and are consistent with energies computed for proton transfer in small peptides from basic residues to the amide backbone. These factors combine to suggest that the rate-limiting step in gas-phase protein unfolding is proton transfer to an exposed region. This procedure provides a facile, rapid method to measure activation energies for gas-phase protein unfolding and dissociation and yields insight into the mechanism of CIU.
Methods
Sample preparation
Myoglobin, streptavidin, Shiga toxin 1 B subunit, β-lactoglobulin, concanavalin A, carbonic anhydrase II, alcohol dehydrogenase, bovine serum albumin, and transferrin were purchased from Sigma Aldrich. Lyophilized proteins were reconstituted in ultrapure (18 MΩ) water before buffer-exchange into 200 mM ammonium acetate, pH 7–7.5 (native-like, positive and negative polarity); 180 mM ammonium acetate 20 mM triethylammonium acetate (TEAA), pH 7 (charge-reduced, positive polarity); or 160 mM ammonium acetate 40 mM TEAA, pH 7 (charge-reduced, positive polarity). Myoglobin was prepared in an 80/20 water/methanol solution to match the conditions used in literature BIRD experiments.37
Native IM-MS and CID/CIU
Ion mobility-mass spectra were acquired using a Synapt G2-Si ion mobility-mass spectrometer (Waters Corp.) equipped with a nanoelectrospray source. A Flaming-Brown P-97 micropipette puller (Sutter Instruments) was used to pull nanoelectrospray emitters from borosilicate capillaries with an i.d. of 0.78 mm to a final i.d. of approximately 1 μm. Samples were electrosprayed by applying a potential of ±0.7–1.1 kV to a platinum wire in electrical contact with 3–5 μL of solution in the emitter. “Sensitivity” mode and traveling wave velocities of 450–550 m/s and heights of 20–25 V were used for all experiments. The source block was equilibrated to ambient temperature, nitrogen was used as the mobility gas at a flow rate of 50 mL/min, and helium and argon (in the “Trap” collision cell) flow rates were 100 mL/min and 5 mL/min, respectively. Measured arrival time distributions were converted to collisional cross sections following an established literature procedure,38,39 using cytochrome C, β-lactoglobulin, avidin, bovine serum albumin, concanavalin A, and alcohol dehydrogenase as calibrants. Negative ions were assigned a collisional cross section (CCS) value equal to that of the positive ion of the same protein with the same number of charges – e.g. BSA14– and BSA14+ are assumed to have the same CCS. A comparison of CCS values in positive and negative polarity showed that CCS differences between the two polarities are negligible for native-like ions.40
For collision-induced unfolding (CIU) experiments, a single charge state was isolated using the quadrupole and the ion unfolded by modulating the acceleration voltage into the Trap (Trap CE), beginning below the threshold for unfolding and increasing in 1 V increments until the most compact conformer family disappeared or a quasi-equilibrium was reached. Collision-induced dissociation (CID) experiments were performed similarly, with the criteria for the upper and lower bounds of Trap CE being the appearance of measurable product monomer(s) and disappearance of measurable precursor, respectively.
Theory
In order to determine quantitative activation energies from dissociation or unfolding kinetics data, the rate constant and effective temperature must be known. We previously published a model for collisional activation in a Synapt G2-Si that can be used to determine the effective temperature for a protein ion at a given collision energy.36
| (1) |
where T0 = 298 K is the initial ion temperature, x is the overall fraction of initial kinetic energy converted to internal energy (computed using our Monte Carlo simulation approach), z is the number of charges, e is the fundamental charge, V is the collision voltage, Nat is the number of atoms in the protein, and kB is the Boltzmann constant. Assuming pseudo-first-order kinetics for these unimolecular reactions, the rate law will be given by
| (2) |
where [R] is the abundance of the precursor ion, [R+P] is the total abundance of precursor and product ions, k is the rate constant, and t is the reaction time. Rewriting this expression in terms of the rate constant gives
| (3) |
The reaction time cannot be directly measured in a Synapt G2-Si, unlike in an FT-ICR, but it can be estimated from our simulations of collisional activation. The ions enter the Trap collision cell with high velocity, but quickly slow down as most of the kinetic to internal energy conversion occurs in the early portion of the Trap. We take the ion’s final velocity exiting the Trap (typically 200–250 m/s, slightly below the 300 m/s traveling wave velocity in the simulations) as representative of the velocity of the ions after energy deposition, which primarily occurs in the first third of the Trap, and estimate that the ions traverse a distance of 20 cm ± 5 cm (the majority of the length of the Trap, plus the SID device and the distance between the SID device and the helium cell, where unfolding/dissociation is effectively quenched) following activation. From those values, an estimated reaction time can be determined, values for which are typically ~800 microseconds. Although the uncertainty associated with this time is large (~25%), it has only a small impact on the calculated activation entropy, contributing an uncertainty of 0.5–2% to the final value. With the effective temperature and rate constant determined, activation energies can be computed.
The Arrhenius equation, used in a number of BIRD studies,13–15 provides an empirical relationship between the rate constant, k, and the temperature, T
| (4) |
where A is the pre-exponential factor, and Ea is the activation energy. This can be rearranged to
| (5) |
Substituting the expression for the rate constant, Eq. 3, into Eq. 5, gives the following expression
| (6) |
which simplifies to
| (7) |
The activation energy is then the slope of a linear fit of Eq. 7.
The Eyring equation, which has a firmer theoretical justification than the Arrhenius equation,41 also relates the rate constant and the temperature
| (8) |
where h is Planck’s constant and ΔG‡ is the Gibbs free energy of activation. It can be re-written as
| (9) |
where ΔS‡ is the activation entropy and ΔH‡ is the activation enthalpy. This can be rearranged to
| (10) |
Substituting Eq. 3 for the rate constant into Eq. 10 gives
| (11) |
which can be rearranged to give
| (12) |
The activation enthalpy is then obtained from the slope of a linear fit to Eq. 12, and the activation entropy from the intercept.
CID data analysis
Relative abundances of the product monomer(s) and precursor were computed by integrating the respective peaks in MassLynx 4.1 (Waters Corp.). At each Trap CE the natural logarithm of the negative of the natural logarithm of the precursor relative abundance was taken to yield the y-axis data for Arrhenius analysis. The effective temperature, computed using Eq. 1, was multiplied by the Boltzmann constant and the reciprocal of the result taken to yield the x-axis data. The two data sets were plotted against one another and a linear least-squares fit performed. The slope of the linear fit was used to determine the activation energy, according to Eq. 7.
CIU data analysis
Arrival time distributions for each CIU experiment were extracted using TwimExtract,42 and further data analysis performed in Igor Pro (WaveMetrics). Briefly, at each Trap CE the relative abundances of each conformer family were determined by fitting the arrival time distribution with one Gaussian function for each observed local maximum and computing the relative abundances from the area under each Gaussian. At each Trap CE the negative of the natural logarithm of the relative abundance of the most compact conformer family was divided by the effective temperature determined using Eq. 1 and the natural logarithm of the result taken to yield the y-axis data for Eyring analysis (see below for an example of this procedure). The x-axis data was obtained by taking the reciprocal of the effective temperature multiplied by the Boltzmann constant. The two data sets were plotted against one another and a linear least-squares fit performed. Data points corresponding to relative abundances below 1% for either the compact or unfolded conformer families were excluded from the analysis. Eq. 12 was used to determine ΔH‡ from the slope of the linear fit, and ΔS‡ from the intercept. ΔG‡ was determined from ΔH‡, ΔS‡, and the average effective temperature over the range of data included in the fit.
Results and Discussion
Comparison of our results with BIRD data
Although BIRD has frequently been used to study peptide fragmentation, only a handful of small protein systems have been investigated, most prominently the three referenced here: loss of heme from myoglobin,37 and dissociation of a monomer from streptavidin tetramers and Shiga toxin 1 B pentamers, respectively.43 Representative mass spectra for each protein can be found in the Supporting Information (Fig. S1, S2, and S3). For all species studied, the primary dissociation pathway is the same as that reported in the literature, and no secondary dissociation is observed at the collision voltages used in these experiments. For each protein and charge state, plots of vs. were generated following the procedure described above. Data for one charge state of each protein is shown in Fig. 1, and the rest are collected in Fig. S4.
Figure 1.

Plots of the double natural logarithm of precursor relative abundance versus inverse vibrational temperature for a) myoglobin, 10+ b) Shiga toxin 1, 12+ c) streptavidin, 14+. The purple arrow in b) indicates the end of the data set reported by Sinelnikov et al.,43 while the blue arrow in c) indicates the approximate location of the inflection point observed by Sinelnikov et al.43
For myoglobin, 10+, a small amount of the apo form is present even at very low collisional activation. For this ion, there is a small amount of activation due to the isolation in the quadrupole (Fig. S5), and a small population (< 1% abundance) that dissociates readily with minimal activation. This leads to the flat region of the graph in Fig. 1a, prior to the remaining population reaching the threshold for dissociation, after which point the plot exhibits a linear relationship, allowing Arrhenius parameters to be determined. For both streptavidin, 14+ and Shiga toxin 1, 12+, the relationship between and is linear at lower levels of collisional activation (i.e. higher ) and exhibits some curvature at higher levels of activation. This curvature is likely caused by multiple non-interconverting populations with different reactivities, and/or rearrangement to a more stable conformer family upon activation. Sinelnikov et al., using an FT-ICR, also observe some degree of curvature in Arrhenius plots for streptavidin when little of the precursor remains, which they attribute to the presence of multiple, differently-reactive populations.43 For streptavidin, 14+, scrutiny of their data reveals that the transition point occurs at approximately the same ratio of precursor to products as in this study.43 For Shiga toxin 1, 12+, within the range of precursor abundances studied by Sinelnikov et al. our data are linear. Thus, fitting the initial linear portion of our data provides a reliable basis for a comparison between the energies determined here and those acquired using BIRD; this comparison is presented in Table 1.
Table 1.
Comparison of activation energies obtained using our method and BIRD
For four of the seven species studied, the two values of activation energy are in excellent agreement and are within 3% of each other, while in the remaining cases the discrepancy is less than 10%. In allcases the activation energy determined by our method and by BIRD are within uncertainty of each other, validating our combined experimental and computational approach. These results also demonstrate that, for proteins, quantitative energetic information can be obtained without the need for explicitly computing vibrational modes of the system or microcanonical RRKM rate constants. The long-term reproducibility of this method was assessed and found to be good, with experiments conducted across several months producing relative standard deviations in Ea below 5% (Table S1). It is important to note that obtaining stable, gentle electrospray with minimum non-specific adduction is key to producing reliable data for this method. Another potential source of error is m/z-, charge-, and CCS-dependent transmission efficiencies. Abundance of protein monomers in the m/z and voltage ranges examined here typically varies by ±10% (Fig. S6). In the CID experiments, the sum of the abundances of the precursor and product monomers is nearly constant, whereas the sum of the precursor and product (n-1)-mers abundances decreases with increasing collision voltage (i.e. the (n-1)-mer is suppressed). Thus, the monomer is treated as representative of the true abundance of the products; any discrepancies introduced by this approach are likely small (see Table S2). This approach may break down in cases where the precursor and products are more discrepant in m/z, owing to greater differences in transmission efficiency, and it is important to evaluate the effect of transmission efficiency for each new ion of interest.
The timescale of this method (a set of experiments can be performed in minutes) and its relatively low computational demands provide key advantages relative to other, more rigorous, approaches. Importantly, it is also applicable to the study of a broad range of species, including very large protein complexes and protein unfolding. Other biological macromolecules such as oligonucleotides could also be probed given suitable characterization of the collision physics. Our method rests on several assumptions, including that the protein ions studied have an effective heat capacity that scales linearly with mass, that the ions reach an elevated effective internal temperature following activation, and that they remain at or near that elevated effective temperature until rapid cooling in the helium cell. Considering those assumptions in order, the proteins studied here are large enough that the density of states is much closer to a continuum than for small analytes such as peptide ions, and thus their heat capacity will depend primarily on the number of vibrational modes, which is roughly proportional to mass. The Williams group, among others, has shown that activation via multiple collisions can produce ions with an effective temperature comparable to that produced in BIRD experiments.44 Our simulations indicate that, when collisional cooling is included in the model, ion internal energy remains roughly constant (within a few percent) following an initial, sharp increase (i.e. collisional cooling and heating nearly balance under the conditions considered).36 Factoring in the good agreement between BIRD and our method suggests that our method, while not as precise as BIRD, can provide relatively accurate, quantitative thermodynamic information.
Thermodynamics of gas-phase protein unfolding
The validated method was then used to investigate the energetics of gas-phase protein unfolding for a broad variety of protein ions. A set of monomeric proteins ranging in size from 18–80 kDa were subjected to CIU using both positive and negative polarities. For each protein, multiple charge states were unfolded, including both native-like and charge-reduced species in positive polarity. (Charge states in negative polarity are generally lower than in positive polarity, e.g. for transferrin the highest charge states are 16− and 19+ in negative and positive polarity, respectively.) Overall, ions with an equal number of charges unfold similarly in positive and negative polarity, but not identically, in agreement with a recent report.45 Data for the unfolding of the most compact conformer family were analyzed according to the method described above, and shown in Fig. 2.
Figure 2.

Data analysis scheme, using bovine serum albumin, 16+ as an example. a) Drift time distribution at selected Trap collision voltage (47 V) showing two coexisting conformer families. b) Relative abundance of most compact conformer family for the set of Trap collision voltages, which is transformed to c) Plot of natural logarithm of effective rate constant divided by temperature versus inverse energy. The linear fit gives the activation enthalpy and entropy, and the dashed blue line shows the threshold for quantitation (>1% unfolded conformer family).
Eyring plots (the natural logarithm of the effective rate constant divided by the temperature, plotted versus inverse vibrational temperature) for two representative species, alcohol dehydrogenase (ADH), 12+, and concanavalin A (Con A), 8+, are shown in Fig. 3. ADH, 12+ unfolds such that the most compact conformer family is completely depleted (Fig. 3a), while Con A, 8+ reaches a quasi-equilibrium between the most compact and unfolded conformer families, giving rise to the plateau observed in the Eyring plot (Fig. 3b). Eyring plots for the remaining species are collected in the SI (Fig. S7 and Fig. S8). In some cases, the data exhibit curvature at lower abundances (typically <10%) of the most compact conformer family. In these cases, we fit the initial linear portion of the data. As discussed above, this curvature may arise from multiple non-interconverting populations with different reactivities, and/or rearrangement to a more stable conformer family upon activation. In these CIU experiments, any such rearrangement necessarily must not produce a measurable ΔCCS (i.e. < 3%). Given that the decrease in reactivity tends to manifest when little of the most compact conformer family remains, we expect that it is due to structural rearrangement to a more stable species with similar CCS. Therefore, fitting the initial linear portion of the curves will provide information about the kinetics of the initial compact conformer family, prior to rearrangement.
Figure 3.

Plots of the natural logarithm of the effective rate constant divided by temperature versus inverse vibrational temperature for a) alcohol dehydrogenase, 12+ b) concanavalin A, 8+, which does not unfold fully, leading to the plateau apparent in the plot. The blue dashed line shows the threshold for quantitation (>1% unfolded conformer family).
Activation enthalpies and entropies extracted from the linear fits are plotted against each other in Fig. 4 (activation parameters can be found in Tables S3 and S4). Remarkably, for both polarities there is a strong linear correlation between ΔH‡ and TΔS‡, one that falls on a line of nearly constant ΔG‡. Higher ΔH‡ values for these data are (in general) associated with relatively lower charge states. Interestingly, a correlation between ΔH‡ and ΔS‡ was also noted by Sinelnikov et al. in their BIRD studies of protein complex dissociation.43 A possible cause of this correlation is that a structure with a more tightly-bound proton may have a lower ground-state entropy and thus a larger change in entropy upon conversion to the transition state for the unfolding/dissociation process. In Fig. 4a, four data points lie significantly above the remaining data and do not fit the linear trend. These data arise from the lowest charge-state cations for which measurable unfolding is observed in our instrument for four proteins (concanavalin A, carbonic anhydrase, alcohol dehydrogenase, and bovine serum albumin). Furthermore, all of these are species that do not fully convert from the most compact conformer family to a more unfolded one, but instead reach a quasi-equilibrium with two coexisting populations.
Figure 4.

Plots of ΔH‡ versus TΔS‡ for a) positive and b) negative ions. The black circles are species that fully unfold, the blue dashed lines are lines of constant ΔG‡ (i.e. a slope of 1, best fit lines have slopes of 1.07±0.02 in a) and 1.02±0.02 in b)), and the red triangles are species that reach a quasi-equilibrium between the compact and unfolded states (only observed for positive ions). Notably, these species also have markedly larger ΔG‡ than the rest of the species studied.
These species all have markedly higher ΔG‡ values than the rest of the positive ions studied and are the only ones with ΔG‡ above 80 kJ/mol (Fig. 5). They also have lower ΔH‡ values than do the same proteins with one more proton, which may indicate a different unfolding mechanism at work for these species. Interestingly, this behavior is not observed for negative ions with the same absolute charge as the outlier species. Instead, all the negatively-charged species investigated fall along the linear trend of ΔH‡ vs. TΔS‡. The rest of the positively-charged ions measured have ΔG‡ between 70 and 80 kJ/mol, except for Con A10+ at 68 kJ/mol (Fig. 5). The negatively-charged ions are more unfolded at a given collision voltage in the majority of cases (Fig. S10) and have ΔG‡ values slightly below or approximately equal to the equivalent positively-charged ions, with the single exception of BSA14–/BSA14+ (Fig. 5). These results are intriguing in light of a recent study that found negatively-charged complexes to be more resistant to CID.45 For all proteins studied and both polarities, the lowest charge state has the largest ΔG‡, and ΔG‡ decreases monotonically with increasing charge state.
Figure 5.

Plot of ΔG‡ versus charge state for positive (filled symbols) and negative (open symbols) ions of β-lactoglobulin (black circles), concanavalin A (blue squares), carbonic anhydrase II (red triangles), alcohol dehydrogenase (teal diamonds), bovine serum albumin (maroon pentagons), and transferrin (purple stars). For a given protein, ΔG‡ decreases nearly monotonically with increasing charge state.
Implications for unfolding mechanism
Since the measured ΔG‡ values for a diverse variety of structurally unrelated proteins fall within a narrow range of energies, and ΔG‡ varies more with charge state for a single protein than across proteins, protein and sequence identity are unlikely to be the main determining factors in the unfolding energy. Nor is the size of the unfolding portion of the protein (for which ΔCCS is a proxy) likely to be a major factor, as ΔG‡ varies less across these proteins than does ΔCCS. Instead, the data suggest that charge state plays a vital role. This is borne out by a plot of ΔG‡ against charge density (here, number of charges divided by CCS), which demonstrates a clear negative correlation between ΔG‡ and charge density for positively-charged ions (R2 = 0.77, excluding the four outlier data points. R2 = 0.54 if they are included) (Fig. 6a). Further, quantum mechanical calculations of proton transfer in small, basic residue-containing peptides with well-solvated protons (the case for the proteins studied here, which have more basic sites than charges in every instance) yield ΔG‡ values consistent with ours (~70 kJ/mol for proton transfer to an amide oxygen).46 This suggests the intriguing possibility that our experiments measure the energy of proton transfer from a basic side chain to the peptide backbone, which is likely to be the rate-limiting step in gas-phase protein unfolding for many native-like protein ions. Moreover, the lower charge states tend to be associated with higher ΔH‡ values, consistent with those relatively fewer protons being more tightly bound. Many previous reports have established and commented on the link between charge state and CIU/CID,10,47–49 and this result provides quantitative support for the connection between the Mobile Proton model and CIU.
Figure 6.

Plots of ΔG‡ versus charge density (number of charges divided by CCS) for a) positive and b) negative ions. For positive ions the four species with anomalously high ΔG‡ are also outliers here. There is a strong correlation (R2 = 0.77) between ΔG‡ and charge density for the species that fully unfold. For negative ions there is a weaker correlation between ΔG‡ and charge density (R2 = 0.33).
A weaker correlation between ΔG‡ and charge density is observed for negatively-charged ions (R2 = 0.33) (Fig. 6b), for which fewer native charge states were produced by electrospray. The weaker correlation as compared to positively-charged protein ions may also arise due to differences in the number and identity of protonation/deprotonation sites between positive and negative polarities. Since the ΔG‡ values for negative polarity cluster in the same region as those for positive polarity, the simple explanation is that similar mechanisms are operative in both polarities (i.e. proton transfer is the rate-limiting step). However, while in positive polarity charges can move to many moderately basic sites (such as amide groups) along the peptide backbone, in negative polarity charge mobilization requires donation of a proton to the charged site, limiting the number of groups that can participate. A more direct charge transfer process may be involved in gas-phase unfolding in negative polarity, such as neutralization of salt-bridge interactions leading to increased charge repulsion and unfolding. This mechanism could also be operative in positive polarity, thus preserving the possibility of a unified explanation of gas-phase unfolding for both polarities.
We also considered the effect of instrumental characteristics on the set of transitions that are observable and quantifiable using our instrument (see SI for details). For small to very large proteins, the lower bound of the range of accessible energies is approximately 60 kJ/mol, while the upper bound lies close to 200 kJ/mol for a small protein such as ubiquitin (8.5 kDa) and decreases to ~80 kJ/mol for a very large protein such as GroEL (800 kDa) (Fig. S11). Enhanced control over ion temperature (initial and final) and reaction time via instrument modifications could allow relevant transitions occurring at lower or higher energies to be investigated.
Conclusion
A novel, rapid method for quantitatively determining activation energies for gas-phase protein unfolding and dissociation was introduced. Combining a previously-developed model for energy deposition in collisional activation with unimolecular rate theory enabled measurement of dissociation and unfolding thermodynamics. Values derived using this method agree well with those determined using BIRD. Although our method is more dependent on the veracity of constructed models than is BIRD, we expect that in many cases it will provide results rapidly with reasonable accuracy. Another advantage of this method is that ion internal energies upon activation can be practically sampled more finely than in typical BIRD experiments due to facile adjustment of collision cell voltages. Studies of gas-phase protein unfolding reveal that ΔG‡ values for a given protein decrease with increasing charge state, while those across proteins fall within a narrow range; there is more variation with charge state than with protein identity for the range of native-like and charge-reduced ions probed here. The above results lead us to infer that the CIU transitions observed in these experiments result from proton transfer from a basic site to the peptide backbone. This inference is supported by the concurrence of our experimental ΔG‡ values and those computed for proton transfer in small model peptides.
This work only considered the lowest-energy gas-phase unfolding transition resolvable with a Synapt G2-Si, which is from a compact, native-like structure to another relatively-compact structure. However, subsequent unfolding transitions and MD modeling of changes in CCS may provide additional insight into high-order protein structure and are the subject of future investigations. Also, while charge density and ΔG‡ are found to be correlated, exploring the origins of deviations from the trend may reveal interesting protein-specific impacts on unfolding activation energy. Although the relationship between ΔG‡ values determined here and solution-phase unfolding behavior remains a question for future exploration, the amount of unfolding observed in these gas-phase experiments is typically smaller than that observable with many condensed-phase techniques and thus has the potential to provide more detailed unfolding data than conventional techniques. Further experiments measuring ΔG‡ for ligand dissociation and subsequent comparison to solution-phase binding constants will aid in establishing that link and could yield insights into important biological interactions including enzyme-inhibitor and protein-lipid systems.
Supplementary Material
Synopsis:
A novel method incorporating simulation of internal energy deposition in collisional activation is validated and used to probe the energetics of gas-phase protein unfolding. Charge is found to be the main determinant of activation free energy and a quantitative link between the Mobile Proton Model and CIU is established.
Acknowledgements
M.T.D. acknowledges support from a National Science Foundation Graduate Research Fellowship (DGE-1309047). Research reported in this publication was supported by the National Institutes of Health under award number R21AI125804 (to J.S.P.). The content is solely the responsibility of the authors and does not necessarily represent the official views of the National Science Foundation or the National Institutes of Health.
Footnotes
Supporting Information
Mass spectra, additional protein dissociation and unfolding data, and computation of range of accessible energies based on instrumental capabilities.
References
- (1).Benesch JLP; Ruotolo BT Mass Spectrometry: Come of Age for Structural and Dynamical Biology. Curr. Opin. Struct. Biol. 2011, 21, 641–649. [DOI] [PMC free article] [PubMed] [Google Scholar]
- (2).Hyung S-J; Robinson CV; Ruotolo BT Gas-Phase Unfolding and Disassembly Reveals Stability Differences in Ligand-Bound Multiprotein Complexes. Chem. Biol. 2009, 16, 382–390. [DOI] [PubMed] [Google Scholar]
- (3).Zhou M; Politis A; Davies RB; Liko I; Wu K-J; Stewart AG; Stock D; Robinson CV Ion mobility–mass spectrometry of a rotary ATPase reveals ATP-induced reduction in conformational flexibility. Nat. Chem. 2014, 6, 208–215. [DOI] [PMC free article] [PubMed] [Google Scholar]
- (4).Song Y; Nelp MT; Bandarian V; Wysocki VH Refining the Structural Model of a Heterohexameric Protein Complex: Surface Induced Dissociation and Ion Mobility Provide Key Connectivity and Topology Information. ACS Cent. Sci. 2015, 1, 477–487. [DOI] [PMC free article] [PubMed] [Google Scholar]
- (5).Allison TM; Reading E; Liko I; Baldwin AJ; Laganowsky A; Robinson CV Quantifying the stabilizing effects of protein–ligand interactions in the gas phase. Nat. Commun. 2015, 6, 8551. [DOI] [PMC free article] [PubMed] [Google Scholar]
- (6).Wagner ND; Clemmer DE; Russell DH ESI-IM-MS and Collision-Induced Unfolding That Provide Insight into the Linkage-Dependent Interfacial Interactions of Covalently Linked Diubiquitin. Anal. Chem. 2017, 89, 10094–10103. [DOI] [PubMed] [Google Scholar]
- (7).Laganowsky A; Reading E; Allison TM; Ulmschneider MB; Degiacomi MT; Baldwin AJ; Robinson CV Membrane proteins bind lipids selectively to modulate their structure and function. Nature 2014, 510, 172–175. [DOI] [PMC free article] [PubMed] [Google Scholar]
- (8).Benesch JLP; Aquilina JA; Ruotolo BT; Sobott F; Robinson CV Tandem Mass Spectrometry Reveals the Quaternary Organization of Macromolecular Assemblies. Chem. Biol. 2006, 13, 597–605. [DOI] [PubMed] [Google Scholar]
- (9).Dixit SM; Polasky DA; Ruotolo BT Collision induced unfolding of isolated proteins in the gas phase: past, present, and future. Curr. Opin. Chem. Biol. 2018, 42, 93–100. [DOI] [PMC free article] [PubMed] [Google Scholar]
- (10).Zhong Y; Han L; Ruotolo BT Collisional and Coulombic Unfolding of Gas-Phase Proteins: High Correlation to Their Domain Structures in Solution. Angew. Chem., Int. Ed. 2014, 53, 9209–9212. [DOI] [PubMed] [Google Scholar]
- (11).Tian Y; Han L; Buckner AC; Ruotolo BT Collision Induced Unfolding of Intact Antibodies: Rapid Characterization of Disulfide Bonding Patterns, Glycosylation, and Structures. Anal. Chem. 2015, 87, 11509–11515. [DOI] [PubMed] [Google Scholar]
- (12).Rabuck-Gibbons JN; Keating JE; Ruotolo BT Collision induced unfolding and dissociation differentiates ATP-competitive from allosteric protein tyrosine kinase inhibitors. Int. J. Mass Spectrom. 2018, 427, 151–156. [Google Scholar]
- (13).Price WD; Schnier PD; Williams ER Tandem Mass Spectrometry of Large Biomolecule Ions by Blackbody Infrared Radiative Dissociation. Anal. Chem. 1996, 68, 859–866. [DOI] [PubMed] [Google Scholar]
- (14).Schnier PD; Price WD; Jockusch RA; Williams ER Blackbody Infrared Radiative Dissociation of Bradykinin and Its Analogues: Energetics, Dynamics, and Evidence for Salt-Bridge Structures in the Gas Phase. J. Am. Chem. Soc. 1996, 118, 7178–7189. [DOI] [PMC free article] [PubMed] [Google Scholar]
- (15).Dunbar RC; McMahon TB; Thoelmann D; Tonner DS; Salahub DR; Wei D Zero-Pressure Thermal-Radiation-Induced Dissociation of Gas-Phase Cluster Ions: Comparison of Theory and Experiment for (H2O)2Cl- and (H2O)3Cl. J. Am. Chem. Soc. 1995, 117, 12819–12825. [Google Scholar]
- (16).Price WD; Schnier PD; Williams ER Binding Energies of the Proton-Bound Amino Acid Dimers Gly·Gly, Ala·Ala, Gly·Ala, and Lys·Lys Measured by Blackbody Infrared Radiative Dissociation. J. Phys. Chem. B 1997, 101, 664–673. [DOI] [PMC free article] [PubMed] [Google Scholar]
- (17).Armentrout PB Threshold Collision-Induced Dissociations for the Determination of Accurate Gas-Phase Binding Energies and Reaction Barriers. In Modern Mass Spectrometry, Schalley CA, Ed.; Springer Berlin Heidelberg: Berlin, Heidelberg, 2003, pp 233–262. [Google Scholar]
- (18).Rodgers MT; Armentrout PB Noncovalent metal–ligand bond energies as studied by threshold collision-induced dissociation. Mass Spectrom. Rev. 2000, 19, 215–247. [DOI] [PubMed] [Google Scholar]
- (19).Wysocki VH; Kenttämaa HI; Cooks RG Internal energy distributions of isolated ions after activation by various methods. Int. J. Mass Spectrom. Ion Processes 1987, 75, 181–208. [Google Scholar]
- (20).Leib RD; Donald WA; Bush MF; O’Brie JT; Williams ER Internal Energy Deposition in Electron Capture Dissociation Measured Using Hydrated Divalent Metal Ions as Nanocalorimeters. J. Am. Chem. Soc. 2007, 129, 4894–4895. [DOI] [PMC free article] [PubMed] [Google Scholar]
- (21).Donald WA; Williams ER Measuring the extent and width of internal energy deposition in ion activation using nanocalorimetry. J. Am. Soc. Mass Spectrom. 2010, 21, 615–625. [DOI] [PubMed] [Google Scholar]
- (22).Collette C; De Pauw E Calibration of the internal energy distribution of ions produced by electrospray. Rapid Commun. Mass Spectrom. 1998, 12, 165–170. [Google Scholar]
- (23).Derwa F; de Pauw E; Natalis P New basis for a method for the estimation of secondary ion internal energy distribution in ‘soft’ ionization techniques. Org. Mass Spectrom. 1991, 26, 117–118. [Google Scholar]
- (24).Rahrt R; Auth T; Demireva M; Armentrout PB; Koszinowski K Benzhydrylpyridinium Ions: A New Class of Thermometer Ions for the Characterization of Electrospray-Ionization Mass Spectrometers. Anal. Chem. 2019, 91, 11703–11711. [DOI] [PubMed] [Google Scholar]
- (25).Schnier PD; Price WD; Strittmatter EF; Williams ER Dissociation energetics and mechanisms of leucine enkephalin (M+H)+ and (2M+X)+ ions (X=H, Li, Na, K, and Rb) measured by blackbody infrared radiative dissociation. J. Am. Soc. Mass Spectrom. 1997, 8, 771–780. [DOI] [PMC free article] [PubMed] [Google Scholar]
- (26).Sztáray J; Memboeuf A; Drahos L; Vékey K Leucine enkephalin—A mass spectrometry standard. Mass Spectrom. Rev. 2011, 30, 298–320. [DOI] [PubMed] [Google Scholar]
- (27).Laskin J; Futrell J Internal Energy Distributions Resulting from Sustained Off-Resonance Excitation in Fourier Transform Ion Cyclotron Resonance Mass Spectrometry. II. Fragmentation of the 1-Bromonaphthalene Radical Cation. J. Phys. Chem. A 2000, 104, 5484–5494. [Google Scholar]
- (28).Laskin J; Denisov E; Futrell J A Comparative Study of Collision-Induced and Surface-Induced Dissociation. 1. Fragmentation of Protonated Dialanine. J. Am. Chem. Soc. 2000, 122, 9703–9714. [Google Scholar]
- (29).Laskin J; Byrd M; Futrell J Internal energy distributions resulting from sustained off-resonance excitation in FTMS. I. Fragmentation of the bromobenzene radical cation. Int. J. Mass Spectrom. 2000, 195–196, 285–302. [Google Scholar]
- (30).Rakov VS; Denisov EV; Laskin J; Futrell JH Surface-Induced Dissociation of the Benzene Molecular Cation in Fourier Transform Ion Cyclotron Resonance Mass Spectrometry. J. Phys. Chem. A 2002, 106, 2781–2788. [Google Scholar]
- (31).Laskin J; Futrell JH Surface-induced dissociation of peptide ions: Kinetics and dynamics. J. Am. Soc. Mass Spectrom. 2003, 14, 1340–1347. [DOI] [PubMed] [Google Scholar]
- (32).Gabelica V; De Pauw E; Karas M Influence of the capillary temperature and the source pressure on the internal energy distribution of electrosprayed ions. Int. J. Mass Spectrom. 2004, 231, 189–195. [Google Scholar]
- (33).Laskin J; Bailey TH; Futrell JH Shattering of Peptide Ions on Self-Assembled Monolayer Surfaces. J. Am. Chem. Soc. 2003, 125, 1625–1632. [DOI] [PubMed] [Google Scholar]
- (34).Price WD; Jockusch RA; Williams ER Is Arginine a Zwitterion in the Gas Phase? J. Am. Chem. Soc. 1997, 119, 11988–11989. [DOI] [PMC free article] [PubMed] [Google Scholar]
- (35).Price WD; Jockusch RA; Williams ER Binding Energies of Protonated Betaine Complexes: A Probe of Zwitterion Structure in the Gas Phase. J. Am. Chem. Soc. 1998, 120, 3474–3484. [DOI] [PMC free article] [PubMed] [Google Scholar]
- (36).Donor MT; Mroz AM; Prell JS Experimental and theoretical investigation of overall energy deposition in surface-induced unfolding of protein ions. Chem. Sci. 2019, 10, 4097–4106. [DOI] [PMC free article] [PubMed] [Google Scholar]
- (37).Gross DS; Zhao Y; Williams ER Dissociation of heme-globin complexes by blackbody infrared radiative dissociation: Molecular specificity in the gas phase? J. Am. Soc. Mass Spectrom. 1997, 8, 519–524. [DOI] [PMC free article] [PubMed] [Google Scholar]
- (38).Bush MF; Hall Z; Giles K; Hoyes J; Robinson CV; Ruotolo BT Collision Cross Sections of Proteins and Their Complexes: A Calibration Framework and Database for Gas-Phase Structural Biology. Anal. Chem. 2010, 82, 9557–9565. [DOI] [PubMed] [Google Scholar]
- (39).Ruotolo BT; Benesch JLP; Sandercock AM; Hyung S-J; Robinson CV Ion Mobility-Mass Spectrometry Analysis of Large Protein Complexes. Nat. Protoc. 2008, 3, 1139–1152. [DOI] [PubMed] [Google Scholar]
- (40).Allen SJ; Schwartz AM; Bush MF Effects of Polarity on the Structures and Charge States of Native-Like Proteins and Protein Complexes in the Gas Phase. Anal. Chem. 2013, 85, 12055–12061. [DOI] [PubMed] [Google Scholar]
- (41).Steinfeld JI; Francisco JS; Hase WL Chemical kinetics and dynamics, 2nd ed.; Prentice Hall: Upper Saddle River, N.J., 1999. [Google Scholar]
- (42).Haynes SE; Polasky DA; Dixit SM; Majmudar JD; Neeson K; Ruotolo BT; Martin BR Variable-Velocity Traveling-Wave Ion Mobility Separation Enhancing Peak Capacity for Data-Independent Acquisition Proteomics. Anal. Chem. 2017, 89, 5669–5672. [DOI] [PMC free article] [PubMed] [Google Scholar]
- (43).Sinelnikov I; Kitova EN; Klassen JS Influence of coulombic repulsion on the dissociation pathways and energetics of multiprotein complexes in the gas phase. J. Am. Soc. Mass Spectrom. 2007, 18, 617–631. [DOI] [PubMed] [Google Scholar]
- (44).Schnier PD; Jurchen JC; Williams ER The Effective Temperature of Peptide Ions Dissociated by Sustained Off-Resonance Irradiation Collisional Activation in Fourier Transform Mass Spectrometry. J. Phys. Chem. B 1999, 103, 737–745. [DOI] [PMC free article] [PubMed] [Google Scholar]
- (45).Hong S; Bush MF Collision-Induced Unfolding Is Sensitive to the Polarity of Proteins and Protein Complexes. J. Am. Soc. Mass Spectrom. 2019. [DOI] [PubMed] [Google Scholar]
- (46).Bythell BJ; Suhai S; Somogyi Á; Paizs B Proton-Driven Amide Bond-Cleavage Pathways of Gas-Phase Peptide Ions Lacking Mobile Protons. J. Am. Chem. Soc. 2009, 131, 14057–14065. [DOI] [PubMed] [Google Scholar]
- (47).Bornschein RE; Ruotolo BT Ion mobility-mass spectrometry of charge-reduced protein complexes reveals general trends in the collisional ejection of compact subunits. Analyst 2015, 140, 7020–7029. [DOI] [PubMed] [Google Scholar]
- (48).Pagel K; Hyung S-J; Ruotolo BT; Robinson CV Alternate Dissociation Pathways Identified in Charge-Reduced Protein Complex Ions. Anal. Chem. 2010, 82, 5363–5372. [DOI] [PubMed] [Google Scholar]
- (49).Zhou M; Liu W; Shaw JB Charge Movement and Structural Changes in the Gas-Phase Unfolding of Multimeric Protein Complexes Captured by Native Top-Down Mass Spectrometry. Anal. Chem. 2019. [DOI] [PubMed] [Google Scholar]
Associated Data
This section collects any data citations, data availability statements, or supplementary materials included in this article.