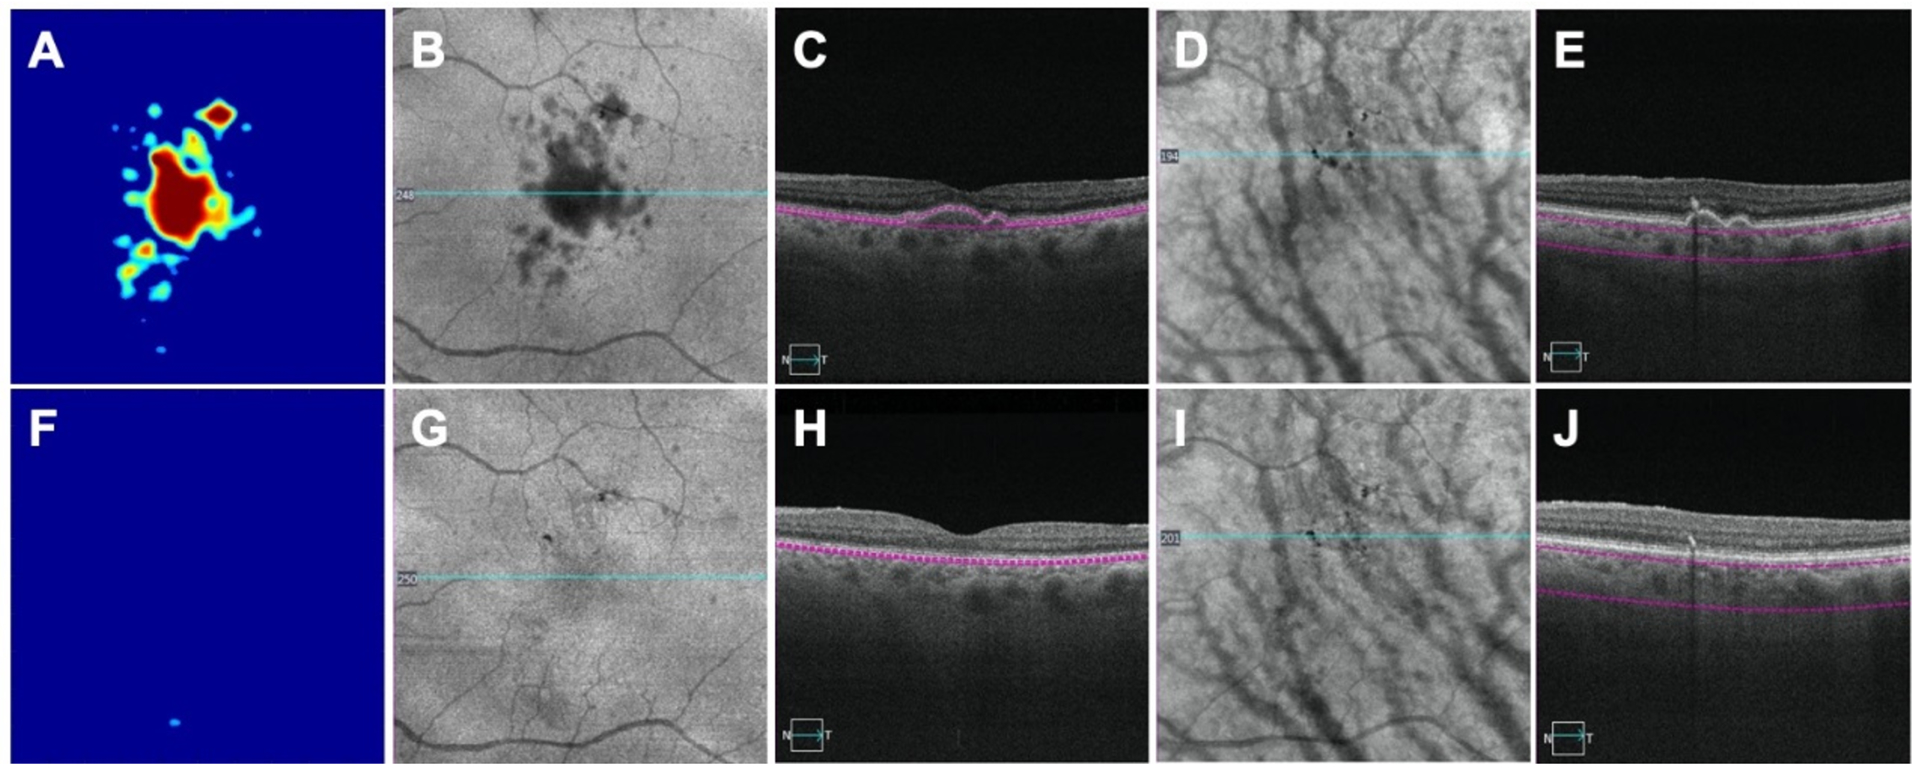
Figure 1:

An eye with drusen imaged by swept source optical coherence tomography angiography (SS-OCTA) before and after the collapse of drusen. A, B, C, D, E: images before drusen collapse; F, G, H, I, J: images after drusen collapse; A, F: drusen volume maps before (0.18 mm3) and after drusen (0.00 mm3) collapse, respectively; B and G: Area of hypo reflectivity corresponding to drusen on the en face structure images obtained by using a custom slab segmented between retinal pigment epithelium (RPE) and Bruch’s membrane (BM); C, H: corresponding B scans showing RPE elevation; D, I: Pigmentation identified as black foci when using en face structure images created by a custom slab located 64 – 400 microns below BM; E, J: corresponding B-scans showing pigmentation as hyper-reflective foci that cause hypo-transmission onto the underlying choroid.
