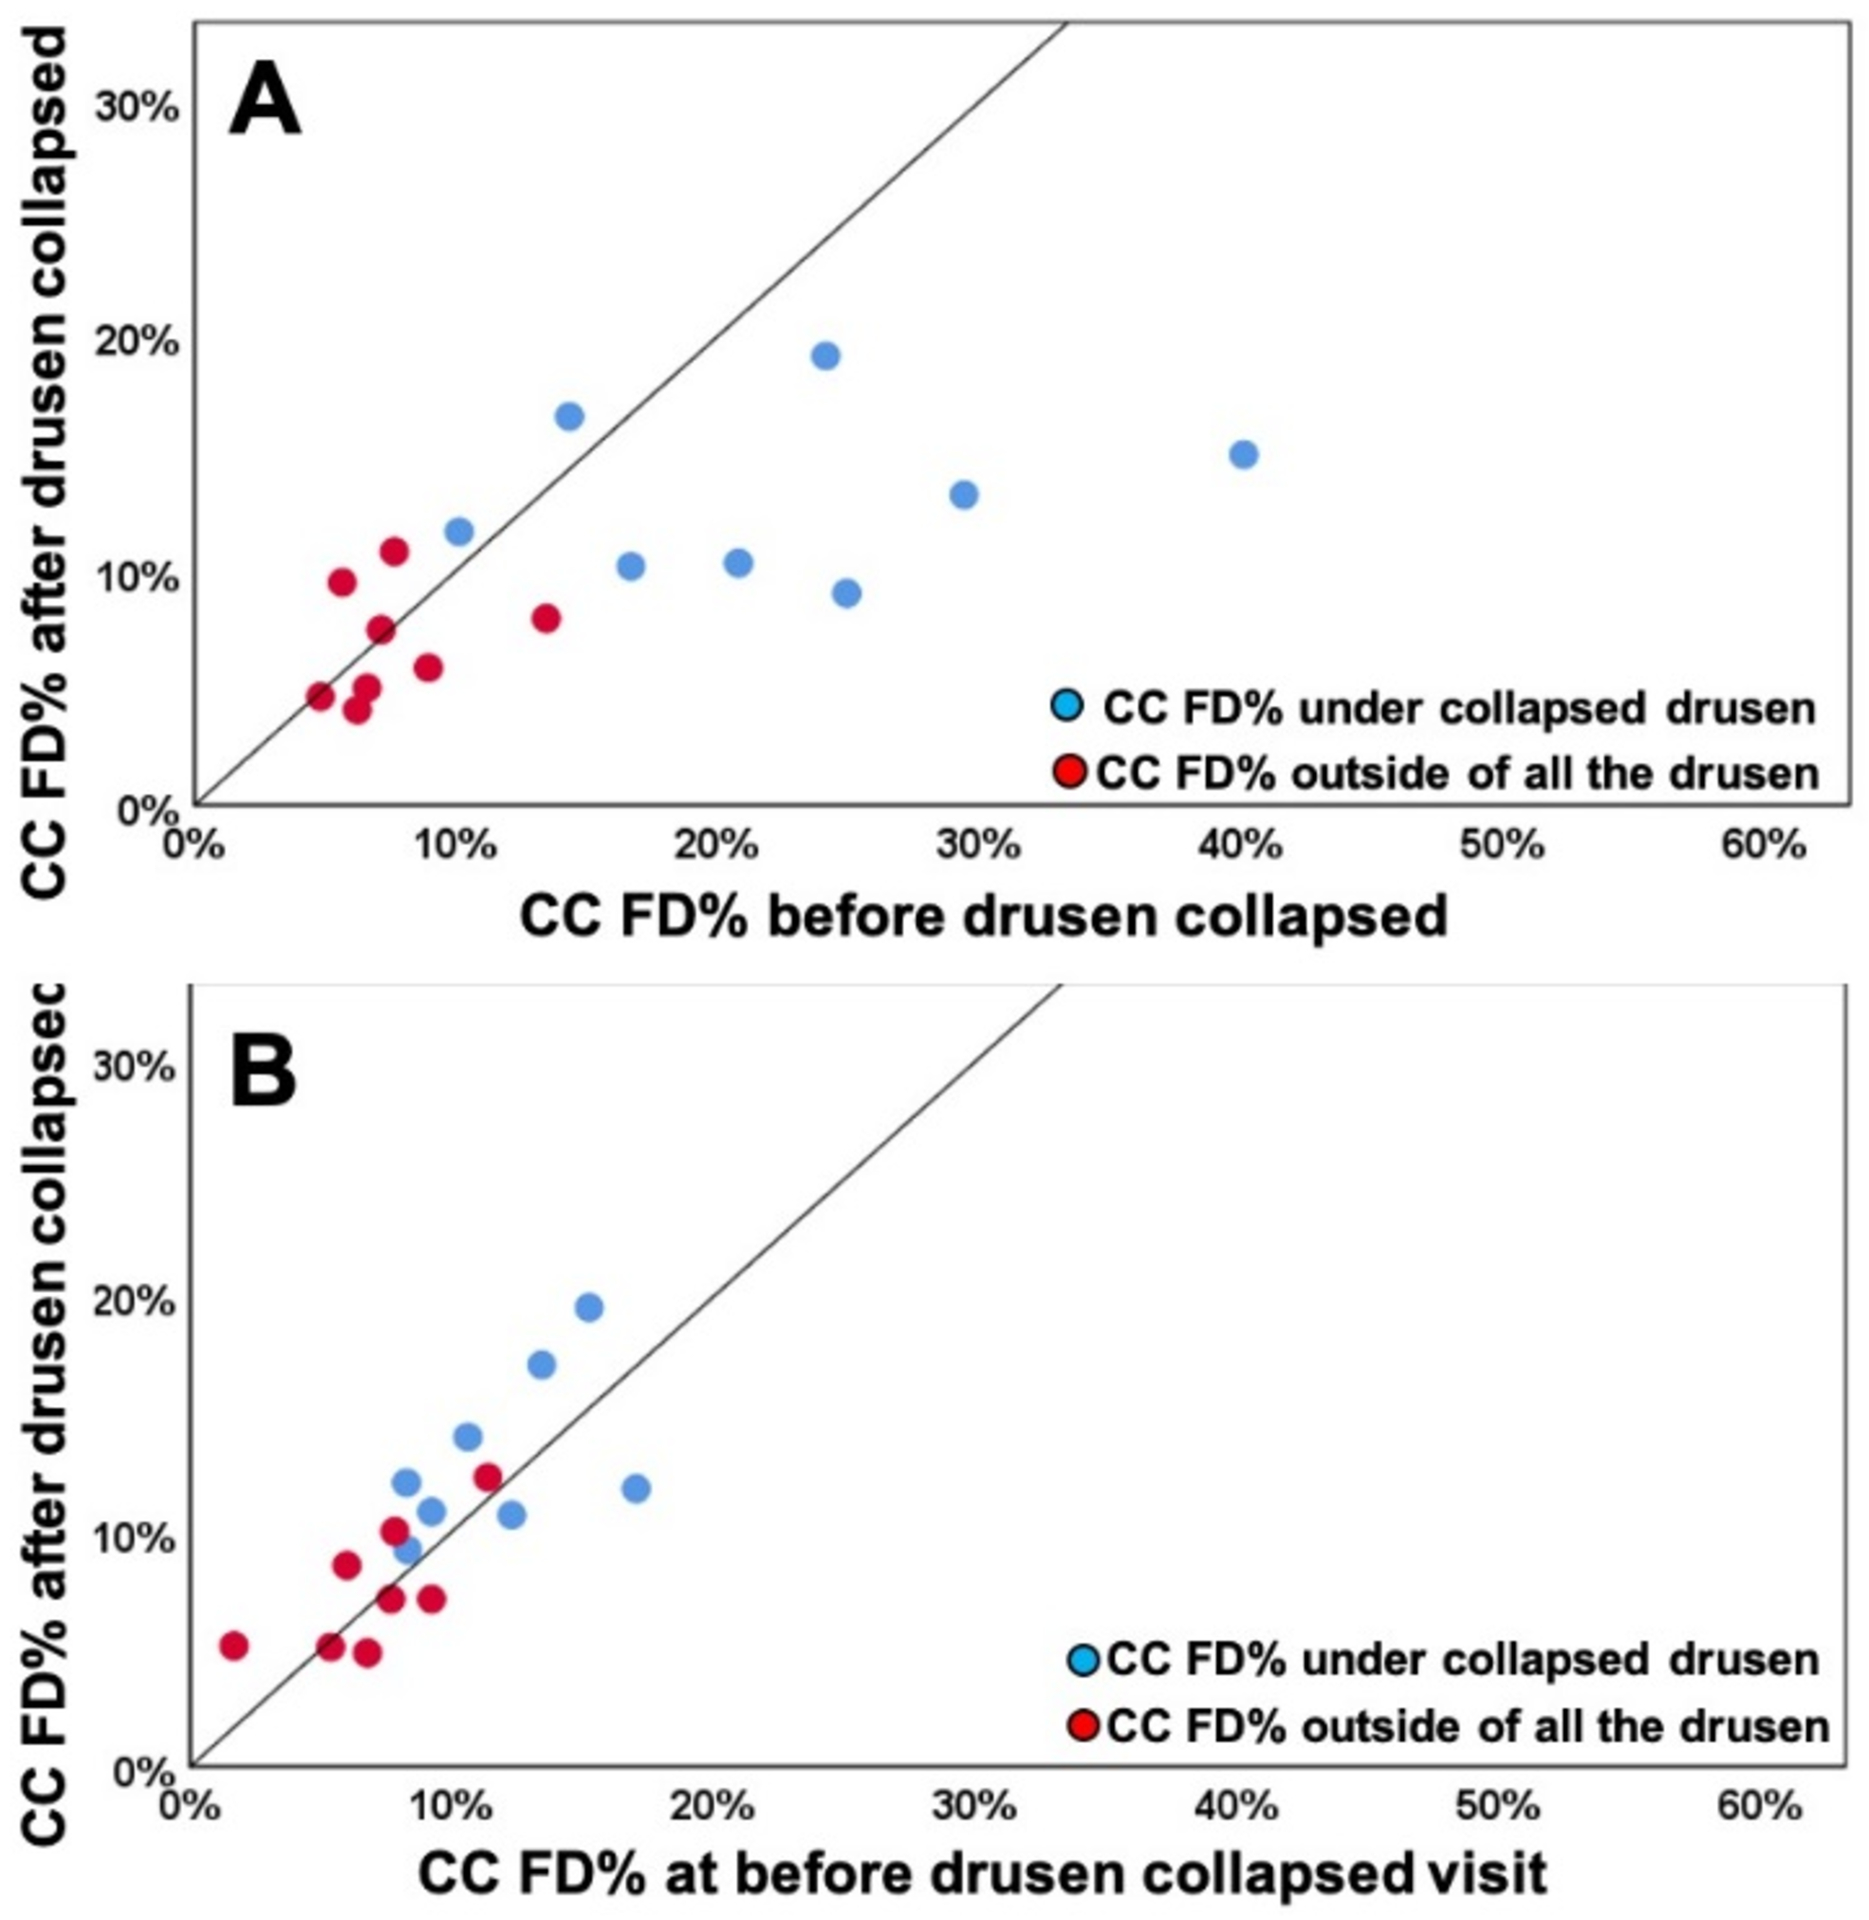
Figure 7:

Comparison of choriocapillaris (CC) flow deficit percentages (FD%) in different regions before and after drusen collapse using uncompensated and compensated CC images thresholded using the Phansalkar method with a 3 pixel widow radius. A: Uncompensated images before and after drusen resolution. A significant difference in the CC FD% was found within the drusen-resolved region (P =0.025) between two follow up visits while the CC FD measures in rim-region showed no difference (P = 0.494); B: Compensated images before and after drusen resolution. No Significant difference in the CC FD% were found in both drusen-resolved region and rim region, P = 0.283 and 0.578, respectively.
