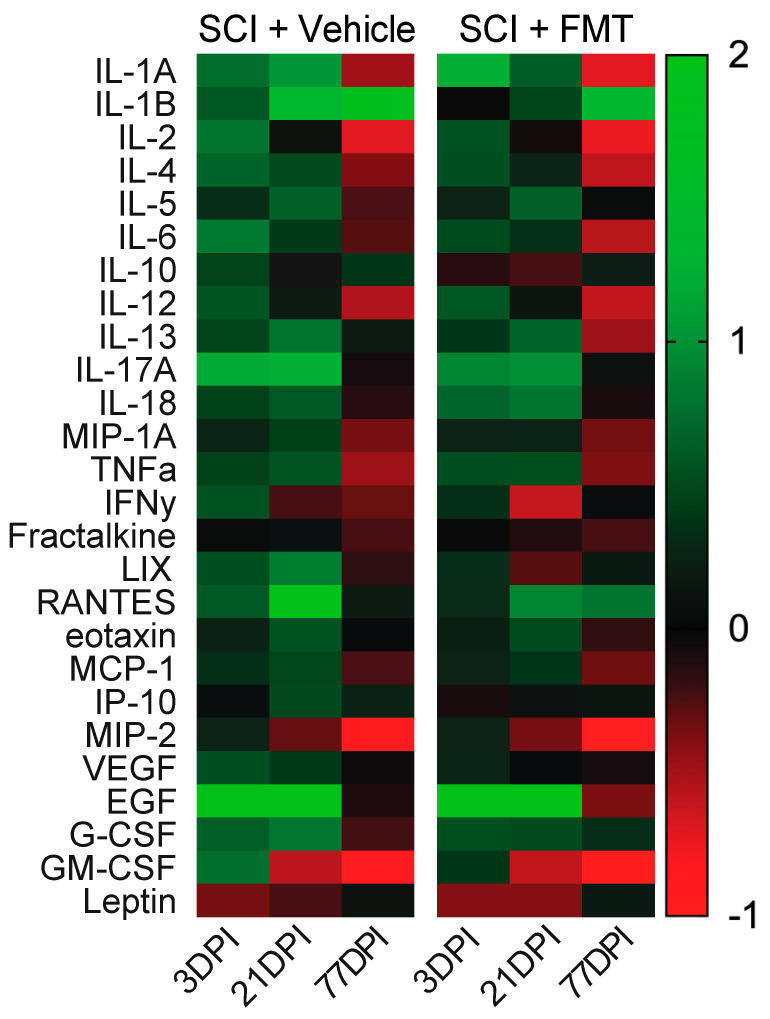
Figure 7.
Heatmap of plasma markers over time following SCI. Plasma markers (cytokines, chemokines, growth factors, glycoproteins and hormones) were expressed as a change from baseline values and plotted over time (positive numbers represent an increase from baseline values and negative numbers represent a decrease from baseline values). Values above 2 were set at 2 for visualization purposes (RANTES and EGF were affected).

