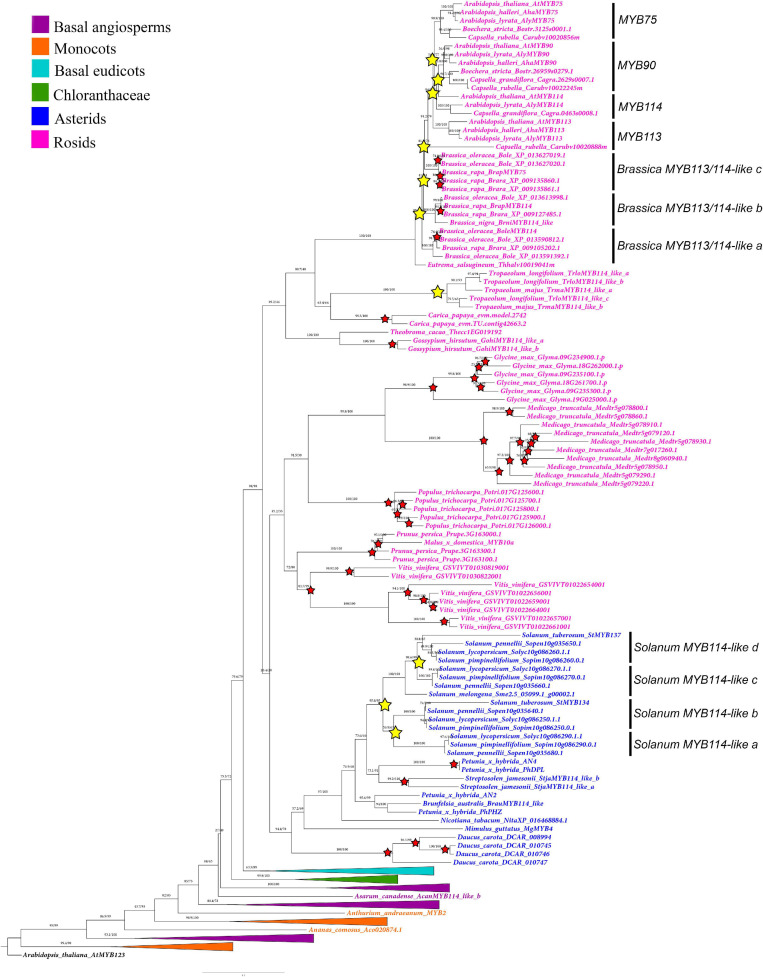
FIGURE 3.
Maximum likelihood analysis of the SG6 R2R3-MYB genes with expanded view of the core-eudicot gene homologs. Yellow stars indicate large-scale duplication events in Solanum and Brassicales. Red stars represent species-specific duplication events. Color clades follow the conventions in the top left.

