

Abstract
Knowledge of intracellular location can provide important insights into the function of proteins and their respective organelles, and there is interest in combining classical subcellular fractionation with quantitative mass spectrometry to create global cellular maps. To evaluate mass spectrometric approaches specifically for this application, we analyzed rat liver differential centrifugation and Nycodenz density gradient subcellular fractions by tandem mass tag (TMT) isobaric labeling with reporter ion measurement at the MS2 and MS3 level and with two different label-free peak integration approaches, MS1 and data independent acquisition (DIA). TMT-MS2 provided the greatest proteome coverage but ratio compression from contaminating background ions resulted in a narrower accurate dynamic range compared to TMT-MS3, MS1 and DIA, which were similar. Using a protein clustering approach to evaluate data quality by assignment of reference proteins to their correct compartments, all methods performed well, with isobaric labeling approaches providing the highest quality localization. Finally, TMT-MS2 gave the lowest percentage of missing quantifiable data when analyzing orthogonal fractionation methods containing overlapping proteomes. In summary, despite inaccuracies resulting from ratio compression, data obtained by TMT-MS2 assigned protein localization as well as other methods but achieved the highest proteome coverage with the lowest proportion of missing values.
Keywords: Subcellular Fractionation, Quantitative Mass Spectrometry, Isobaric Labeling, Label Free
INTRODUCTION
The overall goal of subcellular proteomics studies is to develop comprehensive maps of the cell, assigning individual proteins to the various functional compartments. This information provides important knowledge about the function of individual proteins and the organelles in which they reside and yields insights into physiological processes and disease1–7. Subcellular proteomics experiments typically combine quantitative mass spectrometry with subcellular fractionation3, 8–10 and, when conducted to account for total cellular distribution, these methods can allow for assignment of individual proteins across multiple compartments8. We have focused on rat liver as a model system because there are multiple well-established methods for subcellular fractionation that have been optimized for this biological material11–15. Combining results from different fractionation methods increases confidence in assignment and can potentially improve resolution of mapping but does pose an analytical challenge in terms of missing data between experiments8.
While there are a number of quantitative approaches which have been used in subcellular proteomics studies including isobaric labeling, SILAC (Stable Isotope Labeling with Amino acids in Cell Culture) and label-free quantification2, 3, 8, 9, 16, selecting which approach best suits a given project requires careful consideration. For example, SILAC is limited to samples that allow metabolic labeling, e.g. cultured cells3. Other factors to consider include depth of proteome coverage, dynamic range, quality of location assignment, ability to conduct multiplex analysis of samples and robustness of the approach9, 17–21.
Previously, we used isobaric labeling with MS2 measurement of reporter ions in subcellular localization studies on rat liver8, 14. One of the main advantages of isobaric labeling is that sample multiplexing allows for deep prefractionation of peptides and the method is generally forgiving in terms of stability required during the chromatography and data collection phase22, 23. However, isobaric labeling methods are subject to errors from various sources. Isotopic distribution of reporter ions can result in crossover signal from the designated reporter channel to other reporter channels but this can be readily corrected based on spectra of individual reporter ions, with manufacturers typically supplying accurate correction factors. In addition, MS2 measurement of reporter ions results in quantification errors (ratio compression) due to a background signal derived from co-migrating contaminant peptides in the window where the precursor ion is isolated for fragmentation24, 25. One approach to diminish errors attributable to contaminating background signal is synchronous precursor selection26, 27, which involves isolation of multiple MS2 fragment ions derived from a single peptide precursor for further fragmentation to measure reporter ions at the MS3 level26, 28. We shall refer to these two types of isobaric labeling experiments as TMT-MS2 and TMT-MS3.
Label-free methods in which the area under the curve of chromatographic peaks is integrated can be conducted at the precursor ion (MS1) and/or fragment ion (MS2) levels. Unlike isobaric labeling, unlimited numbers of different samples can be analyzed in any given experiment. Label-free quantification in MS1 may also be accurate over a greater dynamic range than isobaric labeling20. Data independent acquisition (DIA) is another label-free approach which quantifies MS2 ions generated from systematic fragmentation of precursor ions within defined m/z windows. It is suitable for proteome-wide measurements and accuracy can approach targeted MS/MS29, 30.
The goal of most quantitative MS projects is to compare the relative or absolute amounts of proteins in different samples. Here, criteria for selecting the most appropriate method includes accuracy of measurement and depth of coverage (Fig. 1), and a number of studies have compared methods for peptides or phosphopeptides17–21, 31. However, for subcellular proteomics studies, accuracy of protein measurement is not the primary objective but it is just one factor contributing to the goal of correctly assigning as many proteins as possible to their true subcellular location (Fig. 1). Intuitively, it would seem likely that the most accurate measurements would provide the best assignments of compartmental localization. However, this is not necessarily the case given that localization of new proteins is conducted using a reference set of known marker proteins analyzed within the same experiment, thus factors that affect accuracy of measurement apply to both markers and unknowns, and these errors can potentially cancel out. Thus, evaluating MS methods for subcellular localization requires a careful weighing of coverage and ability to correctly assign protein location, not accuracy of protein measurement per se, and in this respect, these studies differ from conventional quantitative MS experiments (Fig. 1).
Fig. 1. Development of experimental workflow for conventional comparative proteomics and subcellular proteomics.
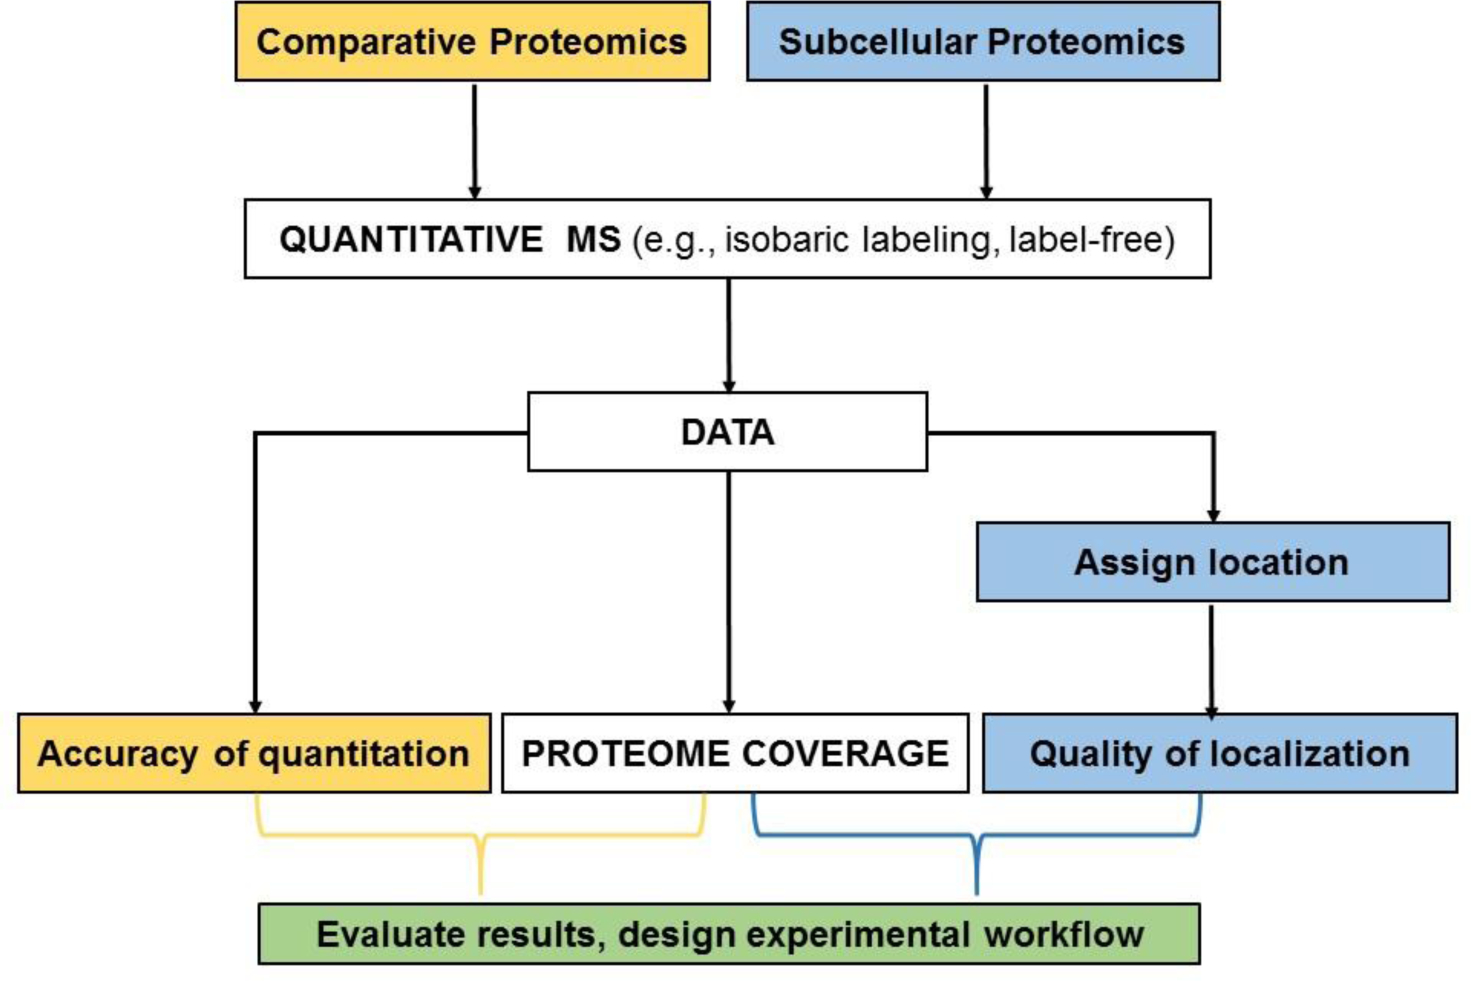
Comparative proteomics involve comparison of two or more groups of samples (e.g., disease or experimental versus control) to determine relative differences between groups. In subcellular proteomics, a unique step is assigning the location of each protein with respect to a known reference set using a variety of computational methods including k-means clustering10, machine learning9, 44, or constrained proportional assignment8.
Recognizing this problem, two studies have compared MS methods for subcellular assignment. SILAC, label-free MS1 quantitation and TMT-MS3 were compared in an analysis of mouse primary neurons9 and in general, the three methods performed similarly with >90% accuracy in prediction of location of organellar marker proteins. Another study compared TMT-MS2 with TMT-MS3 and concluded that the latter was preferable based on higher resolution spatial distribution of protein organellar groups in principal component analyses (PCA)2 but did not evaluate the relative utility of both isobaric labeling approaches for accurate protein assignment. These studies did not evaluate DIA, an increasingly popular method for analysis of complex proteomes, nor did they specifically investigate the problem of missing values that can be encountered when a given sample type is analyzed more than once. In subcellular proteomics studies, cell or tissue extracts are often subjected to multiple orthogonal fractionation methods to improve resolution of organellar separation and this is a potential source of missing data.
In this study, we have compared four different quantitative MS approaches for subcellular proteomics application: label-free (MS1 and DIA) and isobaric labeling (TMT-MS2 and TMT-MS3). We evaluate each method in terms of accuracy of protein quantitation, proteome coverage and ability to correctly assign protein location based on a reference marker set. In addition, we use two independent experiments employing different fractionation methods to create samples with overlapping proteomes to allow us to measure the extent of missing data.
Overall, we find that the accuracy of protein measurement was lower with TMT-MS2 than other methods due to ratio compression. Despite this shortcoming, TMT-MS2 assigned protein localization with similar quality metrics as other methods, but proteome coverage was greater and there were fewer missing values. We also found isobaric labeling approaches to be more forgiving in terms of requirement for stable LC-MS and ease of data analysis. These results provide a platform for continued analysis of rat liver and other sources to generate accurate maps of the subcellular proteome, allowing application of multiplex approaches without the need for instrumentation capable of high-resolution MS3. However, our findings also highlight the importance of ultimately evaluating quantitative MS methods for a given study in terms of the overall experimental objective rather than simply by accuracy of protein quantitation.
EXPERIMENTAL PROCEDURES
Materials
Specialized reagents were: Amicon Ultra 0.5ml 30KDa Cellulose filters (Sigma, UFC503024), sequencing grade modified trypsin (Promega, V5111), endoproteinase LysC mass spectrometry grade (Wako, 125-05061), and TMT10 labeling kit (ThermoFisher, 90110).
Experimental design
Quantitative MS methods were evaluated on the same subcellular fractions but these were processed for MS as appropriate for each method (see below). Technical replicates were used for label-free quantification. Boxplot outlier rejection was applied and is described below.
Rat liver fractions
We analyzed material from rat liver fractionation Experiment A described previously8. Briefly, this consists of differential fractions designated E (post nuclear supernatant); N (nuclear fraction); M (heavy mitochondrial fraction); L1 and L2, which are the pellet and supernatant fractions respectively following centrifugation of L (light mitochondrial fraction enriched in lysosomes and peroxisomes); P (microsomal fraction enriched in ER, Golgi and PM); and S (high speed supernatant). The differential fraction L1 was further subjected to centrifugation in a Nycodenz step gradient to yield fractions Nyc1, Nyc2 and Nyc3. We also conducted an additional experiment using a different fasted rat liver where a combined heavy and light mitochondrial (ML) differential centrifugation fraction was resolved into nine fractions by rate zonal centrifugation on a 10–15% sucrose gradient (1,700 × g for 12 min using a SW55Ti rotor). Samples were stored at −80 °C. For both experiments, samples were processed and analyzed similarly except where indicated.
Protein microchemistry
Five independent replicates of each fraction (20 μg of protein) were incubated with 100 mM DTT in 100 mM Tris pH 7.6, 1% lithium dodecyl sulfate for 10 min at 60°C, and then briefly centrifuged at 14,000 × g. Supernatants were collected and successive 2-fold dilutions of a bacterial standard (DrR57) were added to all but one of the samples, starting at a ratio of 1:1200 (wt:wt DrR57:total protein). Samples were digested using the FASP method32 with 30 kDa MW cut-off centrifugal filters (Amicon) and alkylation was performed with 22.5mM iodoacetamide in urea buffer (100mM Tris-HCL, pH8.5, 8M urea) for 40min followed by three washes with urea buffer and three washes with 50mM ammonium bicarbonate. A 16-hr trypsin digestion (1:25 wt:wt ratio of enzyme /substrate) was followed by a 4-hr endoproteinase Lys-C digestion (1:25 ratio), both in 50 mM ammonium bicarbonate. Trypsin cleaves at the C-terminus of K or R except when followed by a proline and Lys-C at the C-terminus of every K. For the ML-rate zonal fractions, digestion was as described above but was followed by an additional 16-hr trypsin digestion. After a final wash with digestion buffer, peptides were collected, dried in a vacuum centrifuge and re-suspended in 0.1% trifluoroacetic acid at a final concentration of 0.5 μg/μl. A portion of the replicate digests was pooled for each fraction and used for isobaric labeling and DIA while the remainder of each replicate was analyzed individually using label-free MS1. Internal retention time peptide standards (iRT) were obtained from Biognosys (Ki-3002-1) and added to samples for label-free quantification according to manufacturer’s instructions.
Additional samples were prepared for an extended spectral library to be used for peak assignment in MS1 label-free quantification. For this library, digests were performed on 100 μg of proteins of three organelle fractions: N, a combination of M, L1, L2, P (named MLP) and S. Digested samples were prepared and each of the three organelle fractions were separated by high pH chromatography fractionation as described below, and iRT standards were added before MS acquisition.
TMT labeling and high pH chromatography fractionation
TMT10plex labeling was conducted according to manufacturer methods then samples were combined, desalted, concentrated by vacuum centrifugation and re-suspended in alkaline buffer 20mM ammonium formate pH10 for fractionation using alkaline RP-HPLC. Peptides were eluted on a X-Bridge C18 column (3.5 μM, 2.1 × 15 cm Waters) at a flow rate of 250 μl/min using a 70 min gradient at 2 % for 7 min, 2–45 % for 43min, 45–100 % for 5min, maintaining at 100 % for 5 min followed by a return to 2 % of Buffer B (90 % acetonitrile in 20 mM ammonium formate pH 10) for 10 min and Buffer A being 20 mM ammonium formate. Fractions were collected and desalted using C18 stage tips before LC-MS33.
Mass spectrometry
TMT-labeled differential centrifugation/Nycodenz fractions were analyzed on an Orbitrap Fusion Lumos coupled to a Proxeon EASY- nLC 1200 system (Thermo Fisher Scientific). Peptides were fractionated on a C18 column (Bridged Ethylene Hybrid (BEH) C18 particles (Waters), 1.7 μM, 130 Å, 100 μM × 30 cm) using a 90 min gradient of 6% to 30% acetonitrile in 0.125% formic acid and 2% DMSO. MS1 scans were collected at 120K resolution, with an AGC target of 1E6, and dynamic exclusion set to 60s. For TMT-MS2, fragmentation was performed using an HCD activation energy of 32 %. AGC target in MS2 was set to 5E4, maximum injection time to 86ms and the analyzer to Orbitrap with a 50K resolution. For TMT-MS3, fragmentation in MS2 was performed with a CID activation energy of 35 %, an AGC of 1.5E4 and a maximum injection time of 60ms with isolation occurring in the quadrupole and detection in the ion trap. The MS2 isolation window was 0.5m/z. HCD fragmentation of MS2 ions was conducted with activation energy of 55% using 10 notches, AGC target of 1.5E5, maximum injection time of 150ms with detection in the Orbitrap at 50K resolution. The isolation window for MS3 fragmentation was based on charge: for +2, the isolation window was 1.2 m/z; for +3, window was 1 m/z; and for +4 to +6, window was 0.8 m/z. MS2 and MS3 analysis of TMT-labeled ML-rate zonal fractions was conducted on different instruments and settings were adjusted accordingly (Table S1).
For MS1 quantification of label-free samples, each of the five independent digests of the subcellular fractions were analyzed in a block design, with each block comprising a complete set of fractions. Samples were analyzed on a Thermo Fisher LTQ Orbitrap Velos Pro coupled to a Thermo Fisher Ultimate 3000 UHPLC. Peptides were fractionated on a C18 column (Magic C18 AQ, 3 μm, 200 Å, 75 μm × 50 cm) at a flow rate of 300nl/min and a gradient of 4–15% of Buffer B for 35min, 15–25% for 65min, 25–50% for 55min and 50–90% for 10min. Buffer A was 0.2% formic acid and Buffer B was 0.16% formic acid, 80% acetonitrile. MS1 scans were conducted in the Orbitrap detector (60,000 resolution, 3E6 AGC, 50ms maximum ion injection time). In parallel, the ion trap was used in data dependent acquisition (DDA) mode. Here, the 20 most intense precursor ions were isolated (2 m/z isolation width, 1E4 AGC, 100ms maximum ion injection time) and fragmented by CID using a collision energy of 35%, with a dynamic exclusion window of 30s. High pH prefractionated N, MLP and S samples were analyzed as above to help assign precursor peaks.
DIA was conducted by combining equal portions of the five independent digests of each subcellular fraction and analyzing each resulting pooled fraction in triplicate in a block design as described above. Samples were analyzed on an Orbitrap Fusion Lumos coupled to an Ultimate 3000 UHPLC (Thermo Fisher Scientific). Peptides were eluted on a C18 column (nanoEase MZ Peptide BEH C18 (Waters), 1.7 μm, 130 Å, 75 μm × 25 cm) at flow rate of 300 nl/min using a gradient of 4–50% B for 120 min and 50–90% B for 7 min. MS1 survey scans were performed at 60K resolution with an AGC of 2.0E5 and precursors were isolated in the quadrupole using 25 isolation windows of 20m/z each over a range of 400–900mz. For MS2 fragmentation, HCD activation energy was 30%, injection time 54ms and AGC target 2E5. Fragment ions were detected in the Orbitrap at 30K resolution. To create the library for DIA, the same samples were analyzed on the Lumos in triplicates using the same gradient, and data was acquired in DDA mode. MS1 survey scans were acquired at 120K and AGC target was 2E5. Isolation was performed using a window of 1.4 m/z and dynamic exclusion was 60s. Ions were fragmented by HCD with an activation energy of 30%. Injection time was 54ms and AGC target was 2E5. Fragment ions were detected in the Orbitrap at 30K resolution.
For label-free experiments, a minimum of five conditioning runs were used to stabilize the chromatography column. Details of MS runs are summarized in Tables S2 and S3.
Peak list generation
Mgf files were generated using Proteome Discoverer 2.1 and 2.2 (Thermo Fisher) with minimum and maximum precursor masses of 350 and 10 000 Da, respectively, minimum signal/noise of 1.5, and no constraints with respect to retention time, charge state, or peak count.
Spectrum matching
Data were searched using the MudPIT option of the Global Proteome Machine (GPM) X!Tandem, version Fury (X! Tandem Alanine (2017.2.1.4) (Beavis Informatics Ltd., Winnipeg, Canada) against the ENSEMBL rat proteome (Rnor. 6, pep.all), bacterial standard DrR57 and a list of common 41 contaminants (dust, contact proteins and trypsin) from the GPM cRAP database. Eleven retention time standard peptides (iRT) sequences were included as appropriate. Parent and fragment errors were 7 ppm and 20 ppm for TMT-MS2, 10 ppm and 0.4 Da for TMT-MS3 and Orbitrap Velos runs, respectively. In silico cleavage was constrained to be C-terminal to K or R except when followed by a proline. N-terminal acetylation and up to 1 missed cleavage was allowed. The first search was performed using TMT-labeling at K and N-terminus and carbamidomethylation at C and U as complete modifications, and oxidation at M as a variable modification. In model refinement, potential modifications were: M and W oxidation, N and Q deamidation, M and W dioxidation, loss of TMT at K and N terminus, TMT at Y and carbamylation at K and N-terminus. The same modifications were used for MS1 but without TMT modification. Maximum peptide valid expectation was set to 0.01. For MS1 analysis, subcellular fractionation runs, conditioning runs and “organelle” library runs were searched together in the GPM. For the differential/Nycodenz fractions searched alone, peptide False Positive Rate (FPR) generated by the GPM was 0.05% for TMT-MS2, 0.1% for TMT-MS3 and 0.08% for Orbitrap Velos runs. For the differential/Nycodenz searched with ML-rate zonal fractions, FPR was 0.06% in TMT-MS2, 0.09% in TMT-MS3, and 0.08% for Orbitrap Velos runs.
Reporter ion extraction for TMT experiments
For TMT-MS2 and MS3, in-house scripts were used to process search results and extract reporter ion intensities (https://github.com/cgermain/IDEAA). Spectra were filtered for a minimum of 2 reporter ions with an intensity of ≥1000. Intensities were corrected for crossover using lot-specific correction values. Reporter ion m/z values were recalibrated against the most abundant reporter ion detected with an error of 20 ppm. After recalibration, reporter ions were extracted using an error of 5 ppm. Only spectra with an expectation value ≤ 0.01 were reported.
MS1 analysis in Skyline
MS1 analysis was conducted using Skyline-daily34. A spectral library was created in Skyline by importing the GPM search results after conversion from .xml to .xtan.xml and changing the retention time from seconds to mins (“rt convert” is a custom script to change retention time units and is located at https://github.com/cgermain/rtconvert). A 1% FDR cut-off was used for library generation and a retention time predictor was set using the 11 iRT peptides and a 5 min prediction window. Peptides filtering settings in Skyline allowed no missed cleavage, carbamidomethylation at C was set as a constant modification, and N-terminal acetylation and oxidation at M were variable modifications. Only fully tryptic peptides identified in the GPM search were imported. For transition settings, only precursor ions with charges +2, +3 and +4 were imported and MS1 filtering was set to allow 3 isotopic peaks and the Orbitrap as a mass analyzer was selected at a resolution of 60,000 at 400 mz. No MS/MS filtering was performed. High-selectivity extraction was checked, and scans were filtered for measured retention times within 5 min of predicted retention times. Raw data was imported using Skyline Runner (https://skyline.ms/wiki/home/software/Skyline/page.view?name=SkylineInstall_64_4-2) and included subcellular fraction runs, conditioning runs and high pH chromatography fractions runs. After raw data import, peak areas were integrated: total MS1 area was the sum of all 3 isotopic peaks for each precursor and exported without grouping the precursors. Data were exported into Excel and processed as described below. A lookup function was used to assign unique peptides to proteins from the corresponding GPM search.
DIA analysis in Spectronaut
Label-free DDA runs acquired on the Lumos were used to create a spectral library for the identification of peptides in DIA. These DDA runs included triplicates of 11 subcellular fractions and five conditioning runs and data were searched against the same databases described above for the GPM, including the iRT database, using the Pulsar search engine of Spectronaut Pulsar X (version 12.0.20491.0.26669) (Biognosys). Carbamidomethylation at C was a constant modification, oxidation at M and N-terminal acetylation were variable modifications and up to 2 missed cleavages were allowed. A decoy library was generated and a false discovery rate (FDR) was set to 1% for both precursors and proteins. Lumos DIA runs were imported and the spectral library was used to identify peptides. MS1 and MS2 tolerances were set to dynamic and retention time calibration was based on iRT regression generated in Spectronaut. Interference correction was activated, keeping a minimum of 2 precursor ions and 3 fragment ions. No precursor grouping was performed and elution groups, which consist of the sum of fragment peak areas per precursor, were used for quantification after setting Q value filtering to sparse which allows an elution group in all runs if it possesses a Q value ≤ 0.01 in at least one run, thus essentially eliminating missing values. No intensity normalization was performed in the software. To assign peptides to protein IDs, DDA runs used for the DIA spectral library were searched using the GPM.
Normalization and median calculation
For TMT experiments, each reporter ion was normalized to the total intensity of that reporter ion in all spectra across all LC-MS runs for that experiment. For label-free analysis, peak areas for precursors (MS1) or elution groups (DIA) were normalized to the sum of peak areas for that LC-MS run. In MS1 and DIA, median values from 5 and 3 replicates, respectively were calculated after normalization.
Data filtering
Data was considered acceptable for quantification after applying the following filters. General filters were applied to all methods:
Modifications that may cause variability in the data are flagged and removed including oxidation at W, dioxidation at M and W, deamidation at N and Q, isobaric labeling at Y and carbamylation at K and the N terminus. This filter was applied for TMT-MS2 and MS3 after reporter ion extraction, and for MS1 and DIA, these modifications were excluded during import in Skyline or Spectronaut, respectively.
Only tryptic peptides and peptides with no missed cleavages were allowed.
A species filter was applied for the final statistical and classification analysis so that the bacterial internal standard DrR57, iRTs and contaminants were removed.
Balance sheet analyses measure the proportion of a given protein that is found in the starting material and is recovered in subsequent subcellular fractionation or centrifugation steps8. A recovery of 1 (100%) indicates that there were no losses due to fractionation or errors in quantification. For this calculation, normalized intensities of each spectrum (TMT), and peak areas of each precursor (MS1) or elution group (DIA) associated with a given fraction are scaled to that which would be obtained from 1 g of rat liver based on the total protein present in each fraction. Recovery was calculated by dividing the sum of these values in the subcellular fractions by the starting material. In the case of the differential fractions, recovery = (N + M + L1 + L2 + P + S)/(E +N), where E+N is equivalent to the homogenate. In the case of ML rate zonal centrifugation, recovery = sum of all 9 fractions/ ML (load). Recoveries between 2/3 and 3/2 were considered acceptable and values outside this range are filtered out.
We also used specific filters for each quantitation method:
Skyline gives each precursor in each run an isotopic dot product (idotp) which is a score that compares observed isotopic peak distribution with the theoretical, with 1 being a perfect match. An idotp for each precursor weighted by its intensity in each run was calculated as follows: weighted Idotp = sum (idotp × intensity) of precursor in each run/sum intensities in all runs. Data were filtered to include only precursors with a weighted idotp ≥ 0.8.
For TMT labeling, spectra were considered acceptable if all available K and N-termini were labeled and that there was no labeling at Y hydroxyl.
Data transformation and MetaMass analysis
After normalization, median calculation where indicated and filtering, data for individual spectra (TMT), precursors (MS1) or elution groups (DIA) were constrained to a common scale so that the values of all fractions (N, M, L1, L2, P, S, Nyc1, Nyc2, Nyc3) summed to 1 (Tables S4–S7). A small value, ε, was added to the constrained values of each fraction to allow log2 transformation. This value was derived from an estimate of background based on the intensity assigned to DrR57 in the samples lacking this standard (0.00044 for DIA, 0.0029 for MS1, 0.030 for TMT-MS2, 0.00054 for TMT-MS3). Data were subsequently log2 transformed. Outlier rejection for each protein was conducted when boxplot outliers are values more than three times the interquartile range beyond the first and the third quartile and this was performed using data acquired at the spectral level for TMT, precursor level for MS1 and elution group level for DIA. For TMT, if a protein had at least 4 spectra and 3 peptides, the mean profile for each protein was calculated using a random effect model to compute a weighted average, accounting for the fact that spectra are nested within sequences. This model was computed using the “Imer” function in the “Ime4” R package35 and prevents a sequence with a very large number of spectra from dominating the mean. Occasionally, the program fails to converge. In this case, or if there is less than 4 spectra and 3 peptides, only the simple mean is calculated. For label-free measurements, a simple mean of precursors (MS1) or elution groups (DIA) per protein was calculated. The data were transformed back to the linear scale, ε subtracted, then re-constrained to 1.
Cluster analysis was performed before importing data into MetaMass which is a tool for analysis of subcellular proteomic data based on k-means clustering, to identify protein groups that have similar subcellular distribution10. Proteins with 2 or more unique peptides were analyzed. Rat genes were converted to human by exporting gene names of rat and human using ENSEMBL Biomart conversion tables36. k-means clustering was completed in Gene Cluster 3.0, allowing 5 genes per cluster with parameters as described10. The kgg output of Cluster 3.0 was imported into the Excel version of MetaMass together with relative protein abundance in all the nine fractions used for the cluster analysis (Tables S8–S11). A list of 1212 proteins consistently assigned in at least two of three high-quality subcellular localization studies2, 3, 8 was used as a compartmental marker set (Table S12). Note that the Excel version of MetaMass automatically converts markers listed as Golgi to ER, and as a work-around, we assigned Golgi makers as endosomal (a category not included in our analysis) and then renamed these as Golgi.
PCA analysis and Euclidian distance
Two-dimensional PCA plots of peptides were generated as described8. For each method, the median for each organellar cluster was first computed, and then the distances (in nine-dimensional space) from each of these to organelle-assigned peptides were calculated.
RESULTS AND DISCUSSION
Experimental strategy
The primary goal of this study was to evaluate different methods for quantitative mass spectrometry, specifically for proteome-wide assignment of protein subcellular location. Our initial experiments used combined differential centrifugation-Nycodenz density gradient fractions described in8. Details of mass spectrometry are summarized in Table S2 with the overall workflow shown in Fig. 2. For TMT-10, each fraction was labeled with a different tag, combined and subjected to high pH chromatographic fractionation to reduce sample complexity. Resulting fractions were analyzed by LC-MS/MS using MS2 and SPS-MS3 fragmentation. For label-free MS1 analysis, a spectral library was generated that included the runs that were quantified in MS1 in addition to other runs on peptides obtained from high pH chromatography fractionation of the N, MLP and S subcellular fractions. A spectral library for DIA was created by collecting DDA data on the same samples, with the same instrument and gradient used for collecting DIA runs.
Fig. 2. Mass spectrometry experimental design.
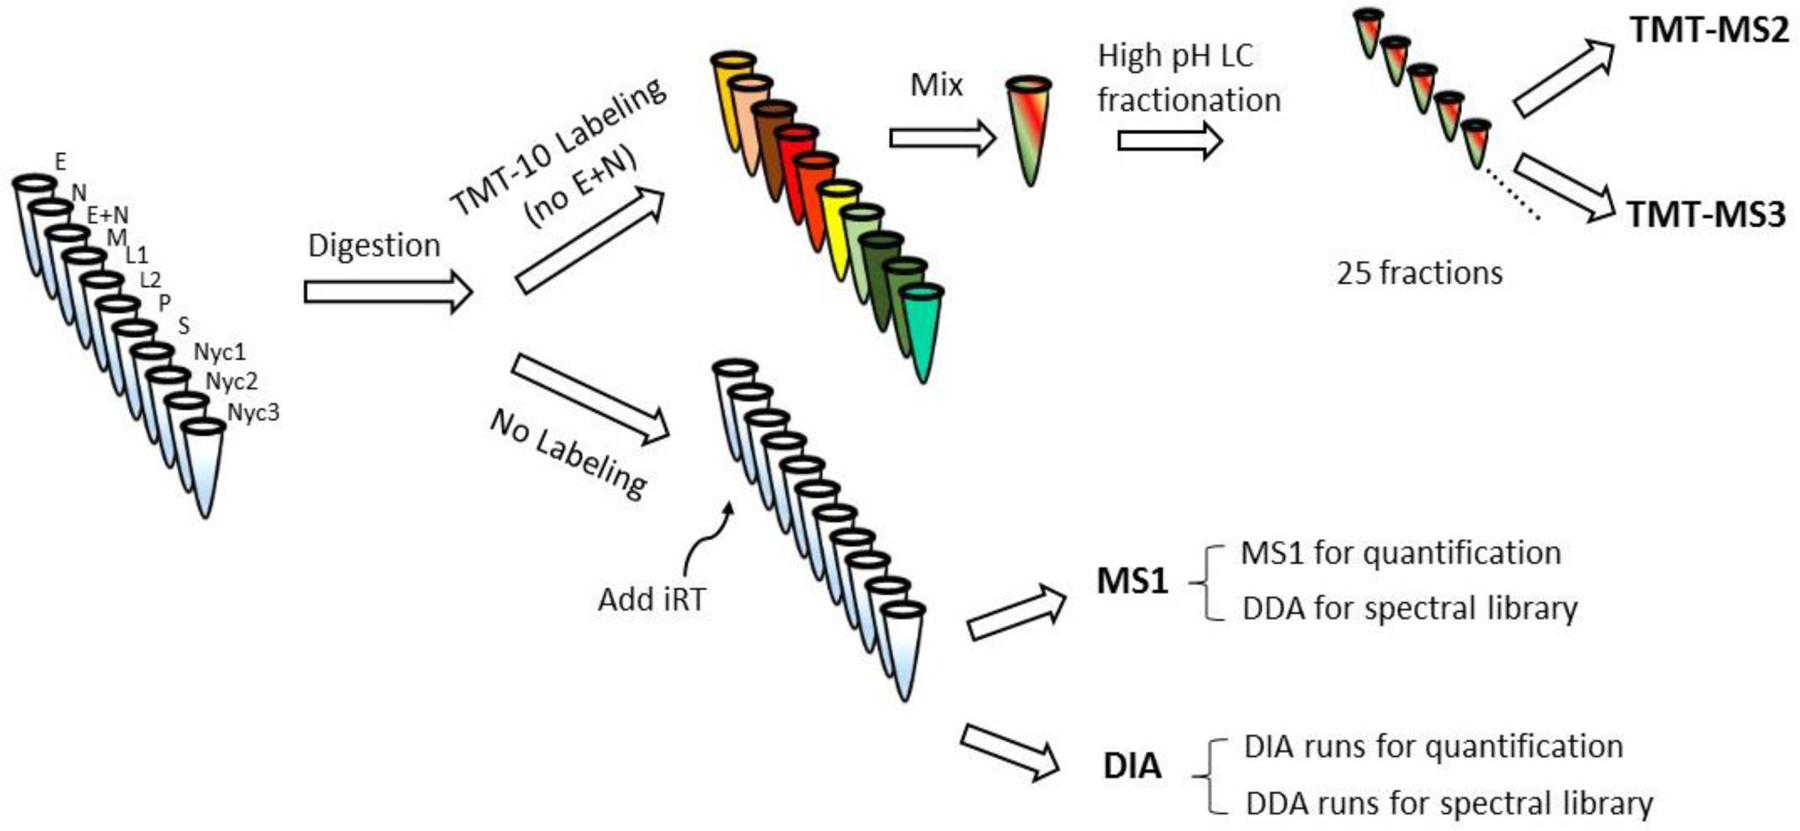
Five independent replicate digests were performed for each of the subcellular fractions. A portion of each replicate was pooled and subjected to TMT10 labeling, omitting the E+N fraction (E+N is a reconstitution of the starting rat liver homogenate, combining the post nuclear supernatant E with the low speed pellet N).
Protein recovery
Balance sheet analyses account for the total subcellular distribution of proteins and provide insights into measurement accuracy. Recovery is calculated as the sum of all the differential fractions (N, M, L1, L2, P, and S) divided by the total starting material (sum of E+N). Perfect recovery will be 1 but errors may occur due to sample handling, unacceptable background signal or instrument noise, or in the case of the label-free methods, inclusion of incorrect peaks for some of the runs. Recoveries between 2/3 (0.67) and 3/2 (1.5) were considered acceptable. Fig. 3 shows recoveries for each of the four methods, and most data fall within the acceptable range. TMT-MS2 and TMT-MS3 showed the highest recoveries, MS1 was slightly lower while DIA recovery was the lowest.
Fig. 3. Balance sheet analysis of recovery.
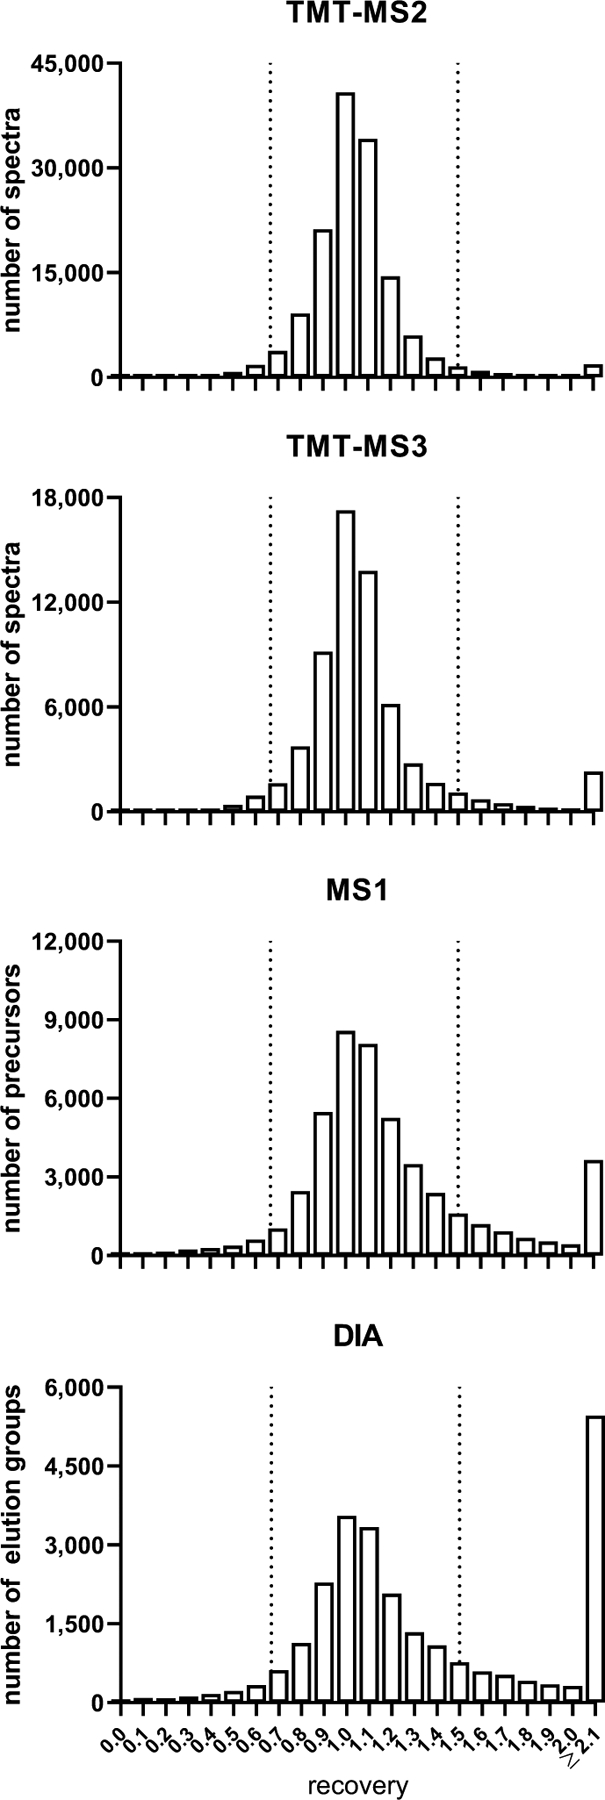
Data are filtered to include only acceptable peptides (fully tryptic with no missed cleavages or flagged modifications, having complete labeling of lysines and N-termini in the case of TMT), and precursors with weighted idotp ≥0.8 for MS1. Vertical dashed lines indicate acceptable recoveries between 2/3 and 3/2.
Proteome coverage
Our long-term goal is to generate a comprehensive map of the subcellular proteome and thus coverage is an important parameter by which to evaluate the different approaches. Table 1 summarizes identification statistics for each method and the relative effects of filters that are implemented to increase accuracy of quantitation. TMT-MS2 and MS1 identified the highest number of acceptable protein assignments (i.e., proteins assigned based on peptides that are fully tryptic with no missed cleavages or unacceptable variable modifications and, in the case of the isobaric labeled samples, complete TMT labeling of K and N-termini - see EXPERIMENTAL PROCEDURES), while TMT-MS3 and DIA identified fewer proteins. Similar trends were observed when we investigated acceptable (criteria as above) peptide assignments using the different methods. For all four methods, we also measured the number of quantifiable peptides and protein assignments (i.e., acceptable peptide/protein assignments with recovery in fractions of 2/3 – 3/2 of starting material - see EXPERIMENTAL PROCEDURES, with an additional requirement for MS1 of a weighted idotp ≥ 0.8). The vast majority of the proteins and peptides were considered quantifiable with the isobaric labeling methods, with 97 and 93% of the peptides having acceptable recoveries (Table 1). The fraction of quantifiable peptides dropped to 68% with DIA (Table 1), which is driven by the increased fraction of peptides where the recovery is >1.5 (Fig. 3). MS1 quantitation resulted in the lowest fraction of quantifiable peptides (54%, Table 1), primarily because of precursors not reaching the desired cutoff for the idotp filter (Fig. S1). Thus, while MS1 has a number of acceptable IDs close to that of TMT-MS2, which had the best coverage, the number of quantifiable IDs was lower and closer to that of TMT-MS3 (Table 1).
Table 1.
Assigned peptides and proteins in differential/Nycodenz fractions.
| Number of Proteins (with ≥ 2 peptides) | Number of Peptides | |||||||
|---|---|---|---|---|---|---|---|---|
| Criteria | TMT-MS2 | TMT-MS3 | MS1 | DIA | TMT-MS2 | TMT-MS3 | MS1 | DIA |
| Acceptable† | 7940 (6321) | 5752 (4374) | 7517 (6416) | 3614 (2947) | 58450 | 32773 | 57582 | 21134 |
| Quantifiable‡ | 7893 (6260) | 5633 (4243) | 5825 (4170) | 3176 (2309) | 56694 | 30512 | 30822 | 14328 |
| % quant | 99.4 (99.0) | 97.9 (97) | 77.5 (65.0) | 87.9 (78.4) | 97.0 | 93.1 | 53.5 | 67.8 |
Acceptable assignments (IDs) are as described in Fig. 3 legend.
Quantifiable IDs are acceptable IDs with recoveries between 2/3 and 3/2 and a weighted idotp ≥0.8 in the case of MS1.
Dynamic range and linear response
Using an internal bacterial standard of known concentration added to each sample with dilutions spanning four orders of magnitude, we examined the limits of accurate linear response with each of the four methods. In Fig. 4A, expected versus measured normalized intensities for the dilutions of DrR57 are plotted on a log10 scale. TMT-MS2 had the narrowest dynamic range and was linear for only ~one order of magnitude. The three other methods showed similar linear responses over ~3-orders of magnitude, with DIA and MS3 being marginally more accurate than MS1.
Fig. 4. Limits of linear response and dynamic range.
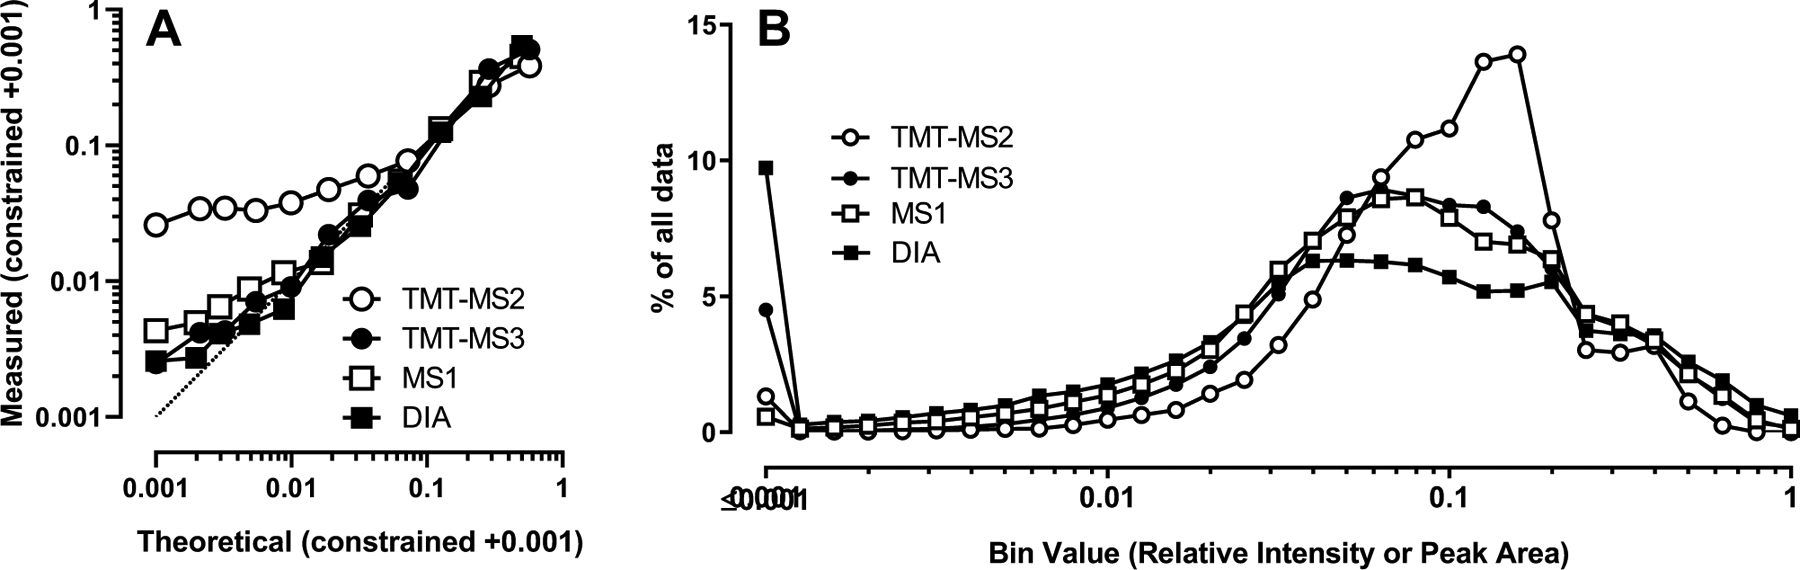
Panel A) Measured peak intensities or areas of serial dilutions of a bacterial standard DrR57 added to the different fractions. Acceptable assignments are as described in Fig. 3 legend. For MS1, only precursors with weighted idotp ≥0.8 are included. Label-free data consisted of ten serial 2-fold dilutions as well as a zero point (11 points) while the third dilution was omitted from the isobaric labeled samples (10 points). Intensities/peak areas associated with each spectrum (TMT), precursor (MS1) or elution group (DIA) were constrained so they summed to 1. Data were log transformed after adding a constant value of 0.001, averaged, back-transformed, re-constrained to 1, and then a constant value of 0.001 added (zero point corresponds to the theoretical value of 0.001). Panel B) Distribution of data for all rat gene products. Data for fractions N, M, L1, L2, P, S, Nyc1, Nyc2 and Nyc3 from all quantifiable (as described in Table 1) spectra (TMT), precursors (MS1) or elution groups (DIA) was plotted after constraining the sum of fraction values to 1.
To investigate accuracy further, we plotted the frequency of all reporter ion intensities (TMT) or peak areas (label-free) on a normalized scale from zero to one (Fig. 4B). TMT-MS3, MS1 and DIA have similar broad distributions while the distribution of TMT-MS2 data is narrower. These results are consistent with the dynamic range of accurate measurements (Fig. 4A), and the tighter distribution of the TMT-MS2 data can be attributed to ratio compression.
For the four different acquisition methods, we plotted profiles for protein reference markers for each organelle (Fig. 5). Organellar profiles are distinct from each other as respective marker proteins are enriched in the appropriate fractions and in general, the four methods gave similar profiles for the different organelles. However, normalized peak intensities for TMT-MS2 were reduced and trough intensities elevated compared to the other methods, reflecting ratio compression associated with MS2 reporter ion measurement. The other methods were similar although the range from peak to trough was typically widest with DIA. These data are again consistent with the results obtained with the DrR57 bacterial standard (Fig. 4A).
Fig. 5. Distribution of representative marker proteins for different subcellular compartments.
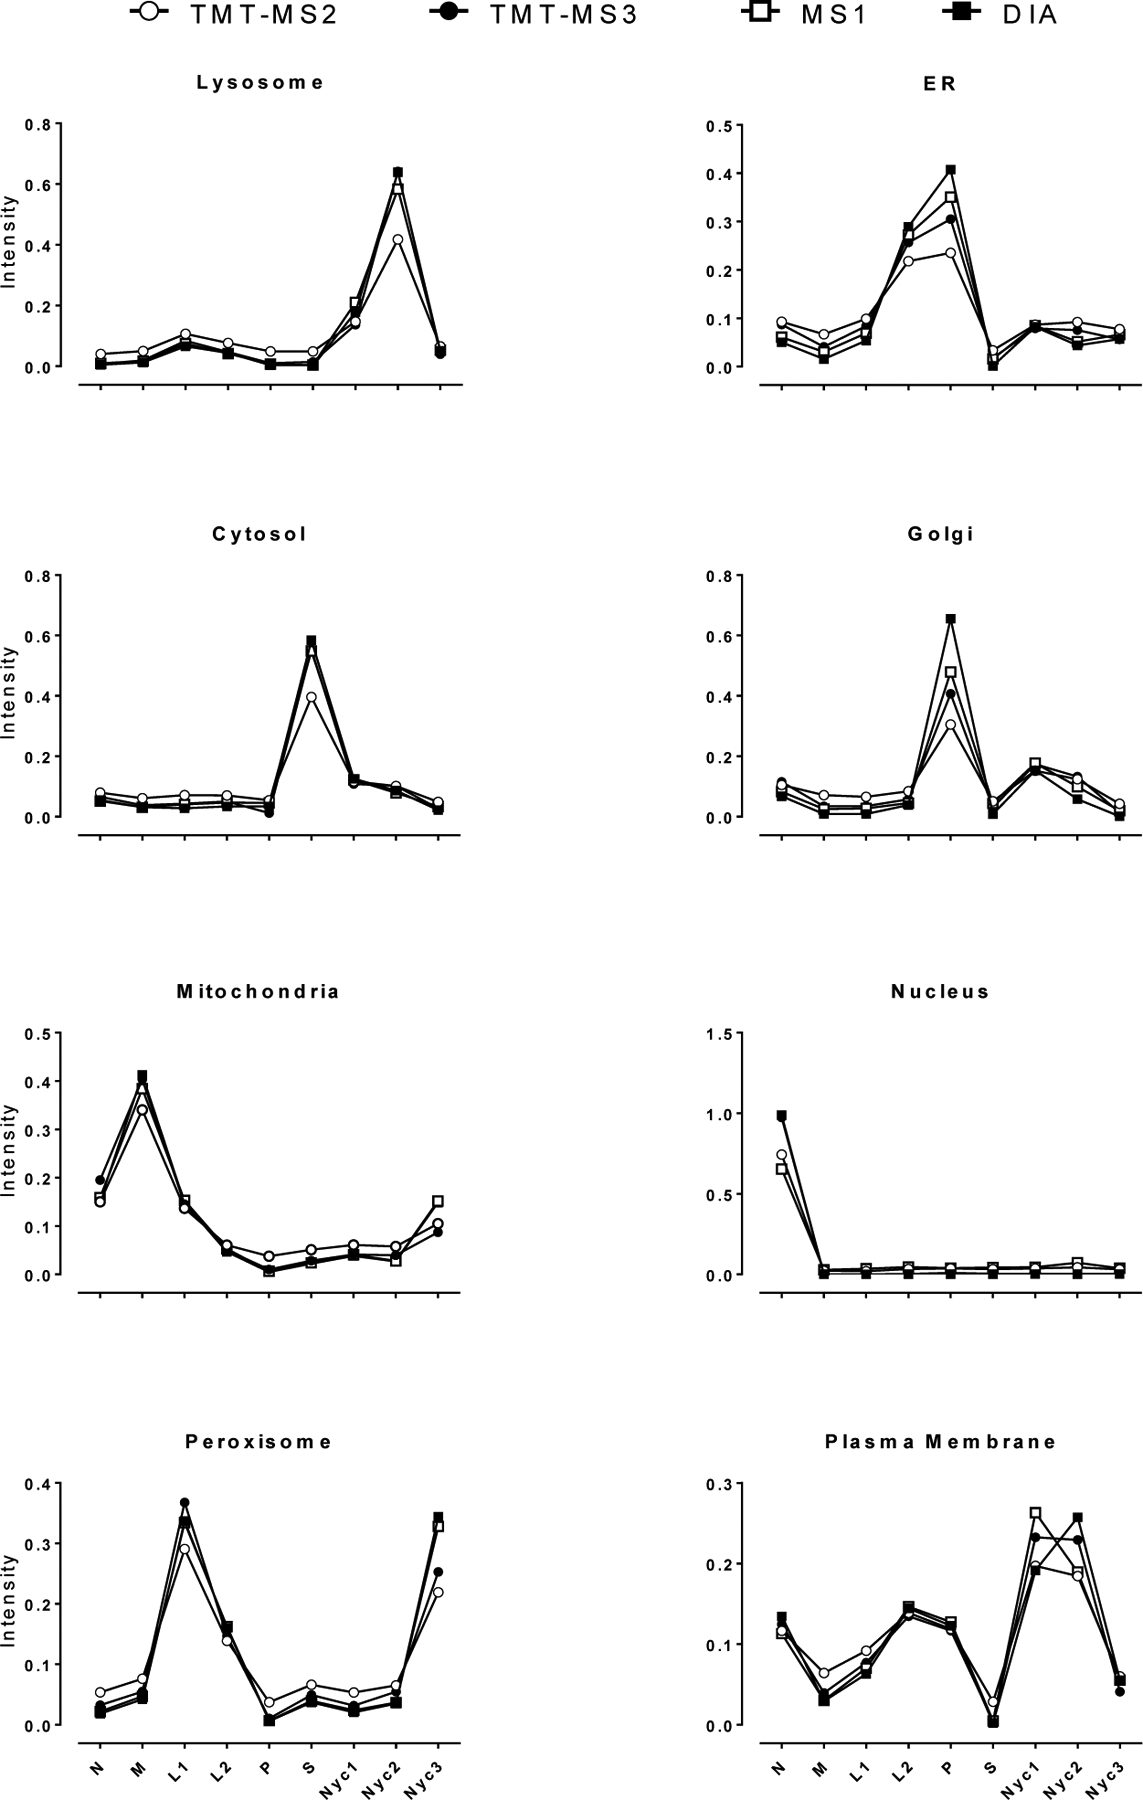
Data were transformed, outliers rejected and mean of assignments of spectra (TMT), precursors (MS1) and elution groups (DIA) calculated as described in METHODS (Data Transformation and MetaMass Analysis). Markers used for each organelle were: lysosomes (HEXA, hexosaminidase subunit alpha), peroxisomes (CAT, catalase), ER (UGGT1, UDP-glucose glycoprotein glucosyl transferase), cytosol (PCK1, phosphoenolpyruvate carboxykinase), Golgi (MAN2A1, alpha-mannosidase 2), mitochondria (CPS1, carbamoyl-phosphate synthase), nucleus (LMNA, Lamin A), plasma membrane (ATP1A1, ATPase Na+/K+ transporting subunit alpha 1). Only quantifiable assignments as described in Table 1 legend were used.
Subcellular classification
MetaMass is a bioinformatic tool developed to provide protein compartmental assignments based on quantitative mass spectrometry analysis of subcellular fractions10. We performed classification predictions using MetaMass to investigate precision of organelle assignments with each method. We compiled a list of 1212 high-confidence organelle markers from three studies2, 3, 8 to use as a training set for classification predictions (Table S12). The number of markers for each organelle are distributed as described in Table S13. Data were first subjected to k-means clustering which defines groups of proteins with similar localization in subcellular fractions10 assigning an average of 5 proteins per cluster. MetaMass then identifies compartmental marker proteins in each cluster and uses the most prevalent marker to assign a location to all proteins in the cluster. Metamass calculates a precision score for each cluster10 where precision = number of “correct” markers (e.g., most prevalent marker) in a given cluster/total number of markers in that cluster,(i.e ., true positives/(true positives + false positives)). Plots are shown in Fig. 6. A straight line indicates 100% precision, i.e., proteins are found in clusters where all markers mapped to the same location. When considering most of the organelles, for TMT-MS2, MS3 and DIA, there was very little decrease in the number of assignments with a precision rate of 100% (i.e., when there are no conflicting markers (false positives) in any of the clusters). However, there was a decrease in precision detected for multiple organelles when MS1 was used. Table 2 provides a summary of MetaMass quality statistics for the marker proteins used for classification. Overall, these results indicate that our MS1 analysis was the method most prone to false positive or false negative predictions in assigning proteins to cellular compartments.
Fig. 6. Number of proteins in assigned compartments as a function of MetaMass cluster precision.
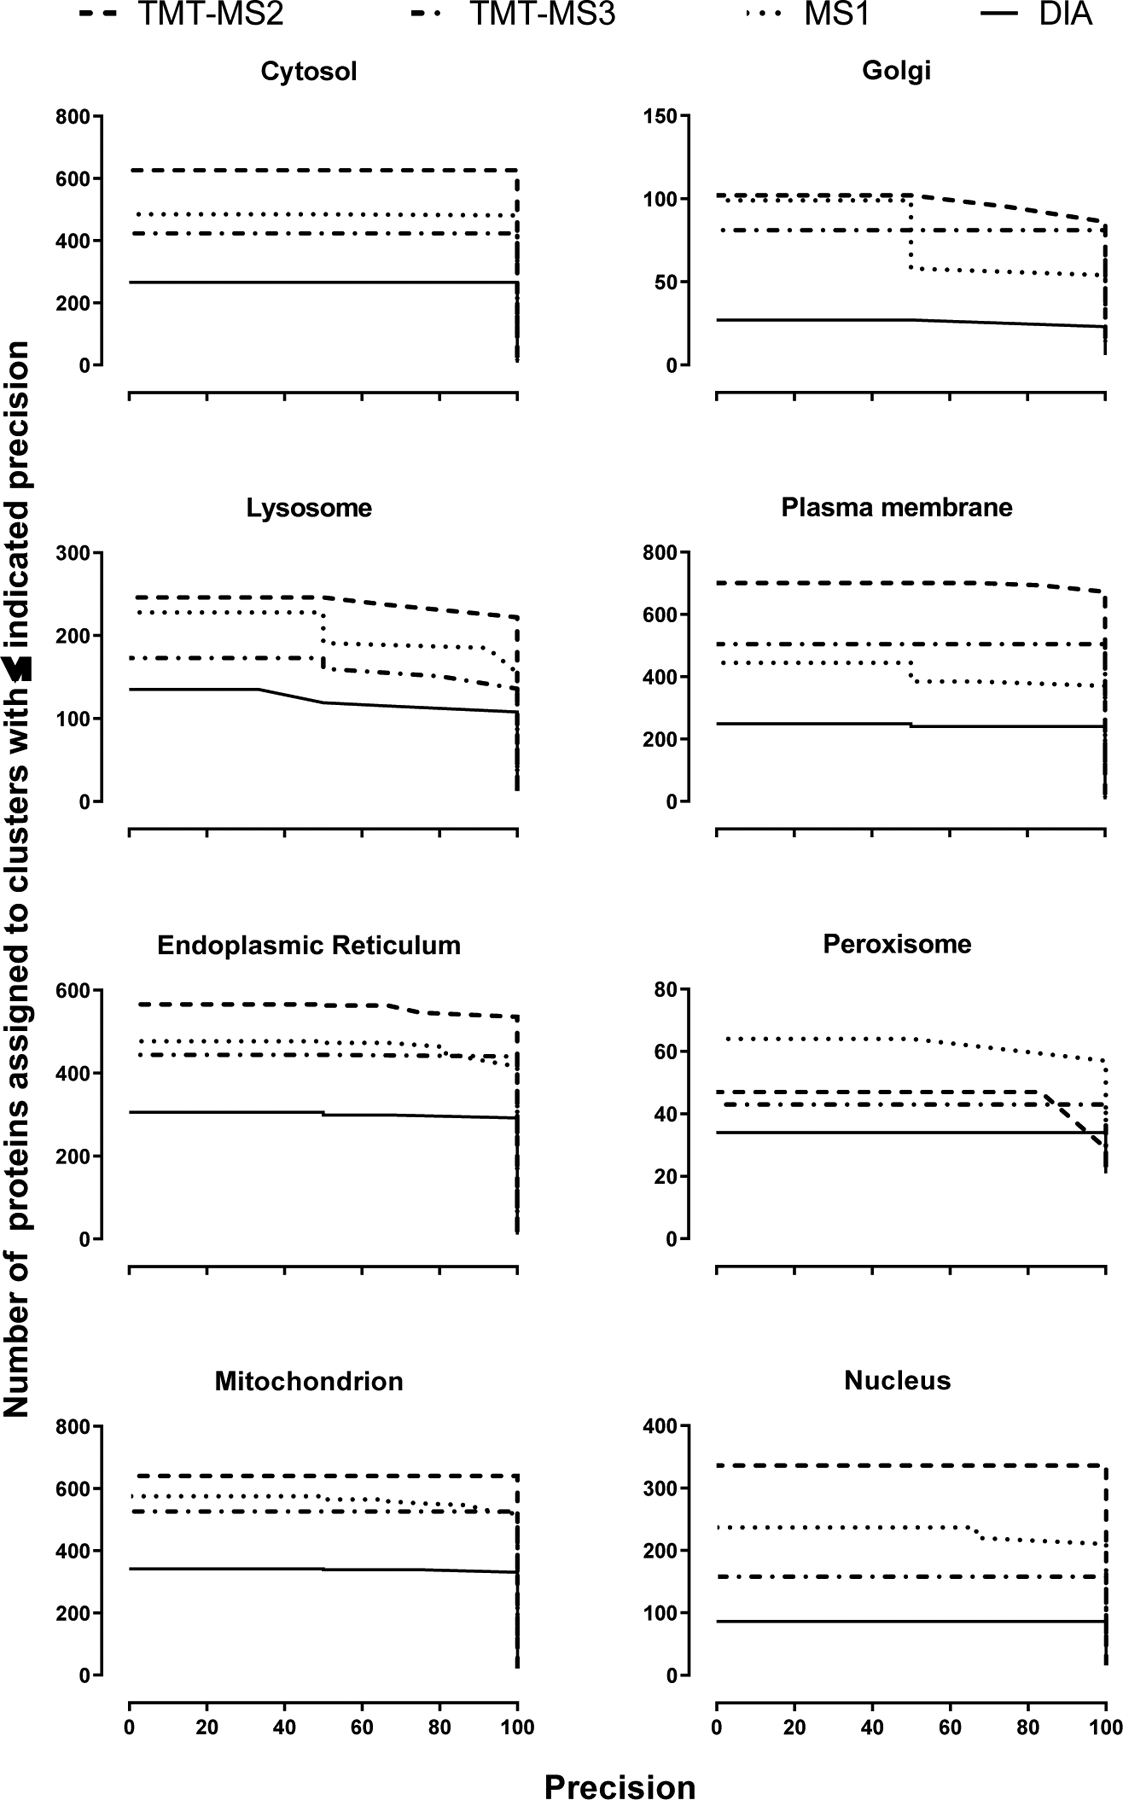
Data transformation and analysis is described in the Experimental Procedures section. Only quantifiable assignments (described in Table 1) and proteins with 2 or more peptides were used.
Table 2.
MetaMass metrics
| Quality Metrics, Markers | ||||
|---|---|---|---|---|
| TMT-MS2 | TMT-MS3 | MS1 | DIA | |
| # in data set | 999 | 829 | 811 | 513 |
| Recall | 98.6 | 99.8 | 94.4 | 96.1 |
| Precision | 97.6 | 99.1 | 92.5 | 96.3 |
| F1 | 98.1 | 99.4 | 93.4 | 96.2 |
| Accuracy | 98.9 | 99.5 | 95.1 | 98.1 |
| All Proteins | ||||
| TMT-MS2 | TMT-MS3 | MS1 | DIA | |
| # in data set‡ | 5892 | 3982 | 4074 | 2243 |
| # classified | 3264 | 2354 | 2610 | 1445 |
| % classified | 55.4 | 59.1 | 64.1 | 64.4 |
calculated from confusion matrices in worksheets S8–S11 using mean precision and recall of individual compartments: precision= true positives/(true positives + false positives); recall = true positives/(true positives + false negatives); F1 score = 2*precison*recall/(precision + recall).
Gene products represented by two or more peptides. Slight discrepancy from Table 1 is due to loss of some rat genes with no human orthologues.
In addition to examining quality metrics within a given method, we also compared agreement and overlap in protein assignments between methods (Table 3). The greatest similarities and the largest intersect of common proteins were obtained when comparing TMT-MS2 and TMT-MS3, likely reflecting similarities in the overall workflow, but agreement in assignments with these two methods and DIA was quite good. In contrast, MS1 had the lowest agreement in assignments with the other methods. This is consistent with the results presented in Table 2 and indicate that the highest quality localization data were obtained with TMT-MS2, TMT-MS3 and DIA.
Table 3.
Pairwise comparison of protein location assignments.
| All proteins | Non-marker proteins | |||
|---|---|---|---|---|
| Comparisons | agreement | # proteins | agreement | # proteins |
| TMT-MS2 ∩ TMT-MS3 | 96.9% | 1963 | 95.6% | 1143 |
| TMT-MS2 ∩ MS1 | 88.9% | 1623 | 83.9% | 1018 |
| TMT-MS2 ∩ DIA | 94.9% | 1117 | 92.8% | 611 |
| TMT-MS3 ∩ MS1 | 90.5% | 1540 | 86.0% | 829 |
| TMT-MS3 ∩ DIA | 94.3% | 1068 | 91.1% | 572 |
| MS1 ∩ DIA | 92.2% | 1162 | 89.1% | 662 |
Orthogonal organelle separation methods to evaluate missing values
In subcellular fractionation studies, orthogonal methods for organelle separation may improve the resolution of compartmental assignment. This requires collation of data from multiple experiments which introduces the significant problem of missing values37, 38. In this study, we define missing values as a case where a protein or peptide is present in two different experiments/fractionations, but is measured or detected in one but not the other. We chose to evaluate the three methods that had the highest proteome coverage in the experiment analyzing differential centrifugation and Nycodenz density gradient subcellular fractions with an independent experiment using a different fractionation method.
We combined M and L differential fractions (ML) and conducted an orthogonal fractionation using rate zonal centrifugation to evaluate the number of proteins and peptides common between this and the differential/nycodenz fractionation experiment. All proteins present in the ML-rate zonal fractions are present in the differential/Nycodenz centrifugation fractions (which include M and L). Thus, if a protein is detected in ML but not in differential/Nycodenz, this is due to the inability of the MS method to detect that protein and not because this protein is absent from differential/Nycodenz. Comparing data from these two experiments can indicate the extent to which missing values present a problem. Data from MS analysis of the differential/Nycodenz and ML-rate zonal fractions were searched together using the MudPIT option of GPM (Tables S14 and S15). Raw data from both experiments were imported together as a single Skyline file for MS1 quantification. Data were evaluated after applying recovery as a filter for TMT-MS2, TMT-MS3 and MS1, and in addition, weighted idotp as a filter for MS1. For TMT-MS2, we found that 96% percent of quantifiable proteins in the ML-rate zonal fractions were also quantifiable in the differential/Nycodenz centrifugation experiment (Table 4). This proportion was lower with TMT-MS3 and MS1 (83% and 88% respectively). Similar trends followed for peptides, though the proportion of quantifiable peptides is generally lower.
Table 4.
Overlap between rate zonal experiment using an ML liver fraction and differential/Nycodenz fractionation experiment using total liver.
| Method | Quantified ML that are also quantified in total† | |||
|---|---|---|---|---|
| Proteins (with ≥2 peptides) | Peptides | |||
| Percentage | Number | Percentage | Number | |
| TMT-MS2 | 96% (97%) | 4999 (3895) | 77% | 27020 |
| TMT-MS3 | 83% (84%) | 4104 (3090) | 55% | 16270 |
| MS1 | 88% (87%) | 5170 (3272) | 61% | 12864 |
Only quantifiable assignments as described in Table 1 legend are used.
CONCLUDING REMARKS
We have compared four quantitative mass spectrometry methods to measure proteins in rat liver subcellular fractions as part of an initiative to map the intracellular proteome. Two label-free and two isobaric labeling approaches were evaluated in terms of mass spectrometry criteria including dynamic range of accurate measurement and depth of coverage. We then evaluated the resulting data in terms of accurately assigning marker proteins to their correct subcellular locations. We were particularly interested in DIA, given that this is reported to be an extremely effective method for obtaining accurate quantitation in large-scale studies of samples containing complex proteomes29, 39.
Our overall conclusions are summarized in Table 5. We find that the accurate dynamic range obtained with TMT-MS3, MS1 and DIA was similar. TMT-MS2 had the narrowest accurate dynamic range, underscoring the problem of ratio compression which results in underestimates of effect size. In terms of depth of coverage, the largest number of quantifiable proteins/peptides was achieved using TMT-MS2, followed by MS1 and TMT-MS3. It is worth noting that we used extensive high pH chromatography fractionation to create the spectral library for peptide assignment in MS1. The MS1 library was derived from 66 high pH LC-fractions compared to only 25 that were analyzed using TMT-MS2. Despite this difference, after applying all filters to select for quantifiable peptides, TMT-MS2 measured more proteins and peptides than MS1. TMT-MS3 provided fewer identifications than TMT-MS2 and this likely reflects the decrease in speed of acquisition28, 40. The number of identified and quantified proteins and peptides using DIA was lowest. Some earlier studies have indicated higher coverage for DIA compared to MS1 quantification or isobaric labeling, but they are not strictly comparable with our analysis. For example, Kelstrup et al41 compared DIA and isobaric labeling analyses on unfractionated samples whereas our TMT analyses were conducted on extensively prefractionated samples. A subsequent study reported greater coverage with TMT than DIA42 and it is likely that comparison studies between DIA and other methods will continue to report different conclusions depending on methods and samples. However, despite using a high-resolution instrument (Fusion Lumos) and engaging experts in the field (Biognosys), who confirmed the quality of our MS data and assisted in analysis, it is clear that with our particular samples, DIA provided lower proteome coverage than other methods. Finally, to evaluate prevalence of missing values, we compared the differential/Nycodenz and ML-rate zonal experiments which are orthogonal fractionation methods. Given that all proteins in the rate zonal of ML are present in the differential centrifugation fractionation of whole rat liver (but not vice-versa), we analyzed the data to determine which proteins and peptides measured in the ML experiment were also -measured in the differential/Nycodenz experiment. The lowest proportion of missing quantifiable assignments was obtained using TMT-MS2.
Table 5.
Overall conclusions
| Method | MS accuracy & dynamic range | Number of quantifiable IDs | MetaMass assignment |
|---|---|---|---|
| TMT-MS2 | + | +++ | +++ |
| TMT-MS3 | +++ | ++ | +++ |
| MS1 | +++ | ++ | ++ |
| DIA | +++ | + | +++ |
In an earlier subcellular proteomics study2, TMT-MS3 was found to be more accurate in terms of protein quantitation than TMT-MS2 but the number of quantifiable proteins was ~23% lower. Consistent with this, we find that TMT-MS3 is more accurate and has a greater dynamic range than TMT-MS2 (Figs. 4 and 5), but we identify ~29% fewer quantifiable proteins with TMT-MS3 compared to TMT-MS2 (Table 1). In PCA analysis and calculation of Euclidian distances between organelle clusters, Christoforou et al2 found that TMT-MS3 achieved a greater spatial resolution of proteins compared to TMT-MS2 and this provided the rationale for continued use of this method in subsequent studies43. We conducted a similar analysis for the four methods of quantitative mass spectrometry used to analyze our differential centrifugation/Nycodenz fractionation experiment (Euclidian distances, Fig. 7; PCA plots, Figs. S2–S4). Consistent with the earlier study2, we find that TMT-MS3 provides greater spatial resolution between organelle clusters than TMT-MS2 (Fig. 7 - the greater the median inter-organelle distance, the higher the spatial resolution). In addition, MS1 achieved higher spatial resolution than TMT-MS2 while DIA achieved the greatest resolution of all four methods. Despite the fact that TMT-MS2 provided the lowest spatial separation of organelles by PCA analysis, when we compare protein assignments using MetaMass (Table 2), we find that, using different metrics for quality of protein assignments,TMT-MS2, TMT-MS3 and DIA are almost identical. This leads us to the important conclusion that the gains in accuracy afforded by TMT-MS3 and other methods compared to TMT-MS2 do not translate to a higher proportion of correct protein assignments. The generality of this conclusion is difficult to evaluate - Christoforou et al2 did not indicate how the improved organellar resolution with TMT-MS3 in PCA analyses translated to quality of protein assignment using their methods. However, these results clearly highlight the importance of evaluating methods in terms of the ultimate experimental goal (in this case, correct protein localization) rather than by individual criteria, e.g., accuracy of protein quantitation or spatial resolution of organellar groups in PCA analyses, which may or may not have a significant effect on the final data.
Fig. 7. Euclidian distance in PCA plots for compartment-assigned peptides to median of indicated cellular compartments.
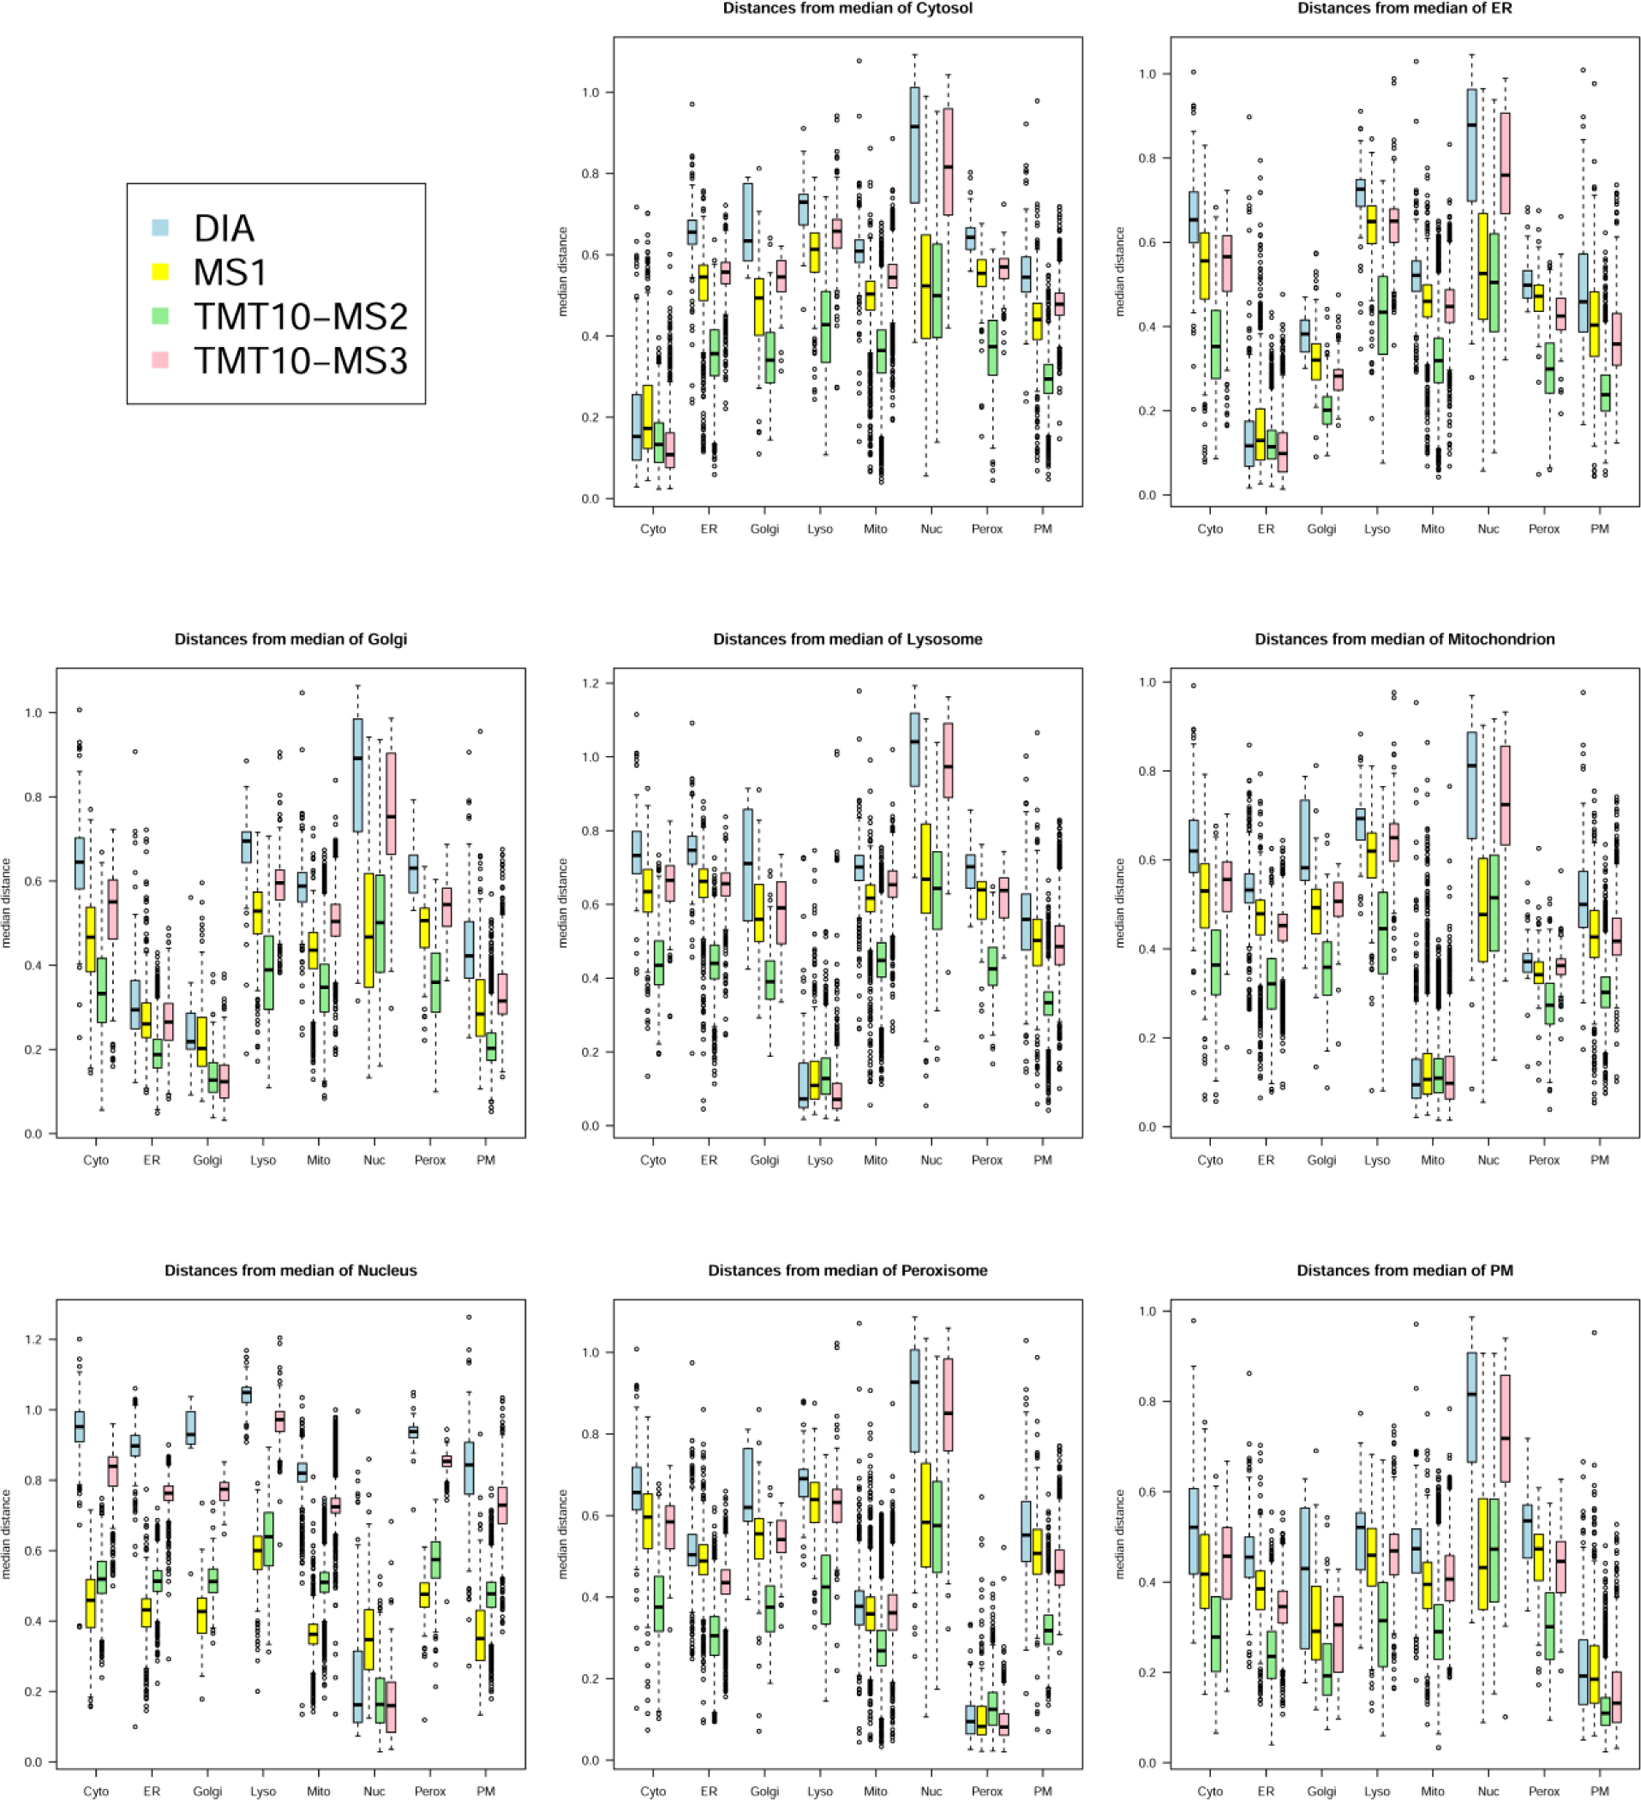
Distances were calculated from PCA plots shown in Supplementary Figs.S2–S4
Given that TMT-MS2 was as precise in assigning protein localization as other methods but provided greater proteome coverage and fewer missing data, our current thinking is that TMT-MS2 will be the most effective route for quantitative MS in the analysis of rat liver at present. In logistic terms, it is also worth mentioning that sample multiplexing in isobaric labeling experiments means that typically fewer MS runs are required than label-free methods for comparable studies and stability of chromatography conditions is less important than required for label-free experiments, where retention time shifts and peak tailing are potentially problematic. In our experience, isobaric labeling studies also requires the least amount of time in terms of data processing and analysis.
Supplementary Material
Table S1. Instrument settings for TMT-MS2 and TMT-MS3 in ML-rate zonal
Table S2. Data acquisition methods for differential centrifugation/Nycodenz fractions.
Table S3. Data acquisition methods for ML-rate zonal fractions
Table S4. Processed filtered quantifications of differential-Nycodenz using TMT-MS2 after normalization, filtering and constraining to a common scale so that the values of fractions sum to 1
Table S5. Processed filtered quantifications of differential-Nycodenz using TMT-MS3 after normalization, filtering and constraining to a common scale so that the values of fractions sum to 1
Table S6. Processed filtered quantifications of differential-Nycodenz using MS1 after normalization, filtering and constraining to a common scale so that the values of fractions sum to 1
Table S7. Processed filtered quantifications of differential-Nycodenz using DIA after normalization, filtering and constraining to a common scale so that the values of fractions sum to 1
Table S8. MetaMass quality metrics for analysis of differential-Nycodenz fractionation by TMT-MS2
Table S9. MetaMass quality metrics for analysis of differential-Nycodenz fractionation by TMT-MS3
Table S10. MetaMass quality metrics for analysis of differential-Nycodenz fractionation by MS1
Table S11. MetaMass quality metrics for analysis of differential-Nycodenz fractionation by DIA
Table S12. Markers list used for MetaMass analysis
Table S13. Number of markers proteins per organelle used for MetaMass analysis.
Table S14. Statistics of assigned proteins and peptides of ML-rate zonal (analyzed with differential/Nycodenz)
Table S15. Statistics of assigned proteins and peptides of Differential/Nycodenz (analyzed with ML-rate zonal)
Fig. S1. Distribution of precursors with weighted idotp.
Fig. S2–S4. PCA analysis of peptides using all four quantitative proteomics methods.
ACKNOWLEDGMENTS
We thank Dr. Martin Wühr for valuable discussions and initial experiments conducted on the Orbitrap Lumos, partly funded by NIH grant R35-GM128813, Dr. Nathan Yates for helpful discussions on experimental design and Virginie Tevel for technical assistance with fractionation experiments. This work was supported by NIH grants P30-NS46593, S10-RR024584 and S10-OD016400 (PL). The content is solely the responsibility of the authors and does not necessarily represent the official views of the National Institutes of Health.
Abbreviations:
- ER
endoplasmic reticulum
- TMT
tandem mass tag
- DIA
data-independent acquisition
- DDA
data-dependent acquisition
- HCD
higher-energy collisional dissociation
- CID
collision-induced dissociation
- PCA
principal component analysis
- PM
plasma membrane
Footnotes
The authors declare no competing financial interest.
MS raw data (. raw), peak lists (.mgf), search engines results (.xml for the GPM and .PSAR for Spectronaut), tables of protein and peptide identifications, initial quantifications (after export from analysis software/script), filtered quantifications before outlier rejection, outlier lists, filtered quantifications after outlier rejection and mean gene calculation, runs and TMT labeling keys, and proteins amounts used for recovery calculations have all been deposited in MassIVE (Mass Spectrometry Interactive Virtual Environment) (http://massive.ucsd.edu) and ProteomeXchange (http://www.proteomexchange.org/) repositories. MassIVE submission numbers are as follows: differential/Nycodenz fractionation: TMT-MS2 (MSV000083842), TMT-MS3 (MSV000083843), MS1 (MSV000083851), DIA (MSV000083844). ML rate zonal fractionation and comparison of the differential/Nycodenz with the ML rate zonal fractionation: TMT-MS2 (MSV000083848), TMT-MS3 (MSV000083850), MS1(MSV000083847).
REFERENCES
- 1.Foster LJ, et al. , A Mammalian Organelle Map by Protein Correlation Profiling. Cell, 2006. 125(1): p. 187–199. [DOI] [PubMed] [Google Scholar]
- 2.Christoforou A, et al. , A draft map of the mouse pluripotent stem cell spatial proteome. Nat Commun, 2016. 7. [DOI] [PMC free article] [PubMed] [Google Scholar]
- 3.Itzhak DN, et al. , Global, quantitative and dynamic mapping of protein subcellular localization. eLife, 2016. 5: p. e16950. [DOI] [PMC free article] [PubMed] [Google Scholar]
- 4.Beltran Jean, Pierre M, Mathias Rommel A., and Cristea Ileana M., A Portrait of the Human Organelle Proteome In Space and Time during Cytomegalovirus Infection. Cell Systems, 2016. 3(4): p. 361–373.e6. [DOI] [PMC free article] [PubMed] [Google Scholar]
- 5.Krahmer N, et al. , Organellar Proteomics and Phospho-Proteomics Reveal Subcellular Reorganization in Diet-Induced Hepatic Steatosis. Developmental Cell, 2018. 47(2): p. 205–221.e7. [DOI] [PubMed] [Google Scholar]
- 6.Nguyen T, Pappireddi N, and Wühr M, Proteomics of nucleocytoplasmic partitioning. Current Opinion in Chemical Biology, 2019. 48: p. 55–63. [DOI] [PMC free article] [PubMed] [Google Scholar]
- 7.Bensaddek D, Nicolas A, and Lamond AI, Signal enhanced proteomics: a biological perspective on dissecting the functional organisation of cell proteomes. Current Opinion in Chemical Biology, 2019. 48: p. 114–122. [DOI] [PubMed] [Google Scholar]
- 8.Jadot M, et al. , Accounting for Protein Subcellular Localization: A Compartmental Map of the Rat Liver Proteome. Molecular & Cellular Proteomics, 2017. 16(2): p. 194–212. [DOI] [PMC free article] [PubMed] [Google Scholar]
- 9.Itzhak DN, et al. , A Mass Spectrometry-Based Approach for Mapping Protein Subcellular Localization Reveals the Spatial Proteome of Mouse Primary Neurons. Cell Reports, 2017. 20(11): p. 2706–2718. [DOI] [PMC free article] [PubMed] [Google Scholar]
- 10.Lund-Johansen F, et al. , MetaMass, a tool for meta-analysis of subcellular proteomics data. Nature Methods, 2016. 13: p. 837. [DOI] [PubMed] [Google Scholar]
- 11.Wattiaux R, et al. , Isolation of rat liver lysosomes by isopycnic centrifugation in a metrizamide gradient. J Cell Biol, 1978. 78(2): p. 349–68. [DOI] [PMC free article] [PubMed] [Google Scholar]
- 12.Appelmans F, Wattiaux R, and de Duve C, Tissue fractionation studies. 5. The association of acid phosphatase with a special class of cytoplasmic granules in rat liver. Biochem J, 1955. 59(3): p. 438–45. [DOI] [PMC free article] [PubMed] [Google Scholar]
- 13.de Duve C, et al. , Tissue fractionation studies. 6. Intracellular distribution patterns of enzymes in rat-liver tissue. Biochem J, 1955. 60(4): p. 604–17. [DOI] [PMC free article] [PubMed] [Google Scholar]
- 14.Della Valle MC, et al. , Classification of Subcellular Location by Comparative Proteomic Analysis of Native and Density-shifted Lysosomes. Molecular & Cellular Proteomics, 2011. 10(4): p. 1–14. [DOI] [PMC free article] [PubMed] [Google Scholar]
- 15.de Duve C, TISSUE FRACTION-PAST AND PRESENT. The Journal of Cell Biology, 1971. 50(1): p. 20d–55d. [PubMed] [Google Scholar]
- 16.Mulvey CM, et al. , Using hyperLOPIT to perform high-resolution mapping of the spatial proteome. Nat. Protocols, 2017. 12(6): p. 1110–1135. [DOI] [PubMed] [Google Scholar]
- 17.O’Connell JD, et al. , Proteome-Wide Evaluation of Two Common Protein Quantification Methods. Journal of Proteome Research, 2018. 17(5): p. 1934–1942. [DOI] [PMC free article] [PubMed] [Google Scholar]
- 18.Megger DA, et al. , Comparison of label-free and label-based strategies for proteome analysis of hepatoma cell lines. Biochimica et Biophysica Acta (BBA) - Proteins and Proteomics, 2014. 1844(5): p. 967–976. [DOI] [PubMed] [Google Scholar]
- 19.Hogrebe A, et al. , Benchmarking common quantification strategies for large-scale phosphoproteomics. Nature Communications, 2018. 9(1): p. 1045. [DOI] [PMC free article] [PubMed] [Google Scholar]
- 20.Williamson JC, et al. , High-performance hybrid Orbitrap mass spectrometers for quantitative proteome analysis: Observations and implications. PROTEOMICS, 2016. 16(6): p. 907–914. [DOI] [PubMed] [Google Scholar]
- 21.Huang F-K, et al. , Deep Coverage of Global Protein Expression and Phosphorylation in Breast Tumor Cell Lines Using TMT 10-plex Isobaric Labeling. Journal of Proteome Research, 2017. 16(3): p. 1121–1132. [DOI] [PMC free article] [PubMed] [Google Scholar]
- 22.Ross PL, et al. , Multiplexed Protein Quantitation in Saccharomyces cerevisiae Using Amine-reactive Isobaric Tagging Reagents. Molecular & Cellular Proteomics, 2004. 3(12): p. 1154–1169. [DOI] [PubMed] [Google Scholar]
- 23.Rauniyar N and Yates J, Isobaric Labeling-Based Relative Quantification in Shotgun Proteomics, in Journal of Proteome Research. - American Chemical Society. p. - 5293. [DOI] [PMC free article] [PubMed] [Google Scholar]
- 24.Savitski MM, et al. , Measuring and Managing Ratio Compression for Accurate iTRAQ/TMT Quantification. Journal of Proteome Research, 2013. 12(8): p. 3586–3598. [DOI] [PubMed] [Google Scholar]
- 25.Sandberg A, et al. , Quantitative accuracy in mass spectrometry based proteomics of complex samples: The impact of labeling and precursor interference. Journal of Proteomics, 2014. 96: p. 133–144. [DOI] [PubMed] [Google Scholar]
- 26.McAlister GC, et al. , MultiNotch MS3 Enables Accurate, Sensitive, and Multiplexed Detection of Differential Expression across Cancer Cell Line Proteomes. Analytical Chemistry, 2014. 86(14): p. 7150–7158. [DOI] [PMC free article] [PubMed] [Google Scholar]
- 27.Sonnett M, Yeung E, and Wühr M, Accurate, Sensitive, and Precise Multiplexed Proteomics Using the Complement Reporter Ion Cluster. Analytical Chemistry, 2018. 90(8): p. 5032–5039. [DOI] [PMC free article] [PubMed] [Google Scholar]
- 28.Ting L, et al. , MS3 eliminates ratio distortion in isobaric multiplexed quantitative proteomics. Nat Meth, 2011. 8(11): p. 937–940. [DOI] [PMC free article] [PubMed] [Google Scholar]
- 29.Gillet LC, et al. , Targeted data extraction of the MS/MS spectra generated by data-independent acquisition: a new concept for consistent and accurate proteome analysis. Mol Cell Proteomics, 2012. 11. [DOI] [PMC free article] [PubMed] [Google Scholar]
- 30.Selevsek N, et al. , Reproducible and Consistent Quantification of the Saccharomyces cerevisiae Proteome by SWATH-mass spectrometry. Molecular & Cellular Proteomics, 2015. 14(3): p. 739–749. [DOI] [PMC free article] [PubMed] [Google Scholar]
- 31.Pappireddi N, Martin L, and Wühr M, A Review on Quantitative Multiplexed Proteomics. ChemBioChem, 2019. 20(10): p. 1210–1224. [DOI] [PMC free article] [PubMed] [Google Scholar]
- 32.Wiśniewski JR, Quantitative Evaluation of Filter Aided Sample Preparation (FASP) and Multienzyme Digestion FASP Protocols. Analytical Chemistry, 2016. 88(10): p. 5438–5443. [DOI] [PubMed] [Google Scholar]
- 33.Rappsilber J, Mann M, and Ishihama Y, Protocol for micro-purification, enrichment, prefractionation and storage of peptides for proteomics using StageTips. Nature Protocols, 2007. 2: p. 1896. [DOI] [PubMed] [Google Scholar]
- 34.Schilling B, et al. , Platform-independent and Label-free Quantitation of Proteomic Data Using MS1 Extracted Ion Chromatograms in Skyline: APPLICATION TO PROTEIN ACETYLATION AND PHOSPHORYLATION. Molecular & Cellular Proteomics, 2012. 11(5): p. 202–214. [DOI] [PMC free article] [PubMed] [Google Scholar]
- 35.Douglas Bates MM, Ben Bolker, Steve Walker, Fitting Linear Mixed-Effect Models Using Ime4. Journal of Statistical Software, 2015. 67(1): p. 1–48. [Google Scholar]
- 36.Vullo A, et al. , Ensembl 2016. Nucleic Acids Research, 2015. 44(D1): p. D710–D716. [DOI] [PMC free article] [PubMed] [Google Scholar]
- 37.Liu H, Sadygov RG, and Yates JR, A model for random sampling and estimation of relative protein abundance in shotgun proteomics. Anal Chem, 2004. 76. [DOI] [PubMed] [Google Scholar]
- 38.Zhang B, Käll L, and Zubarev RA, DeMix-Q: Quantification-Centered Data Processing Workflow. Molecular & Cellular Proteomics, 2016. 15(4): p. 1467–1478. [DOI] [PMC free article] [PubMed] [Google Scholar]
- 39.Bruderer R, et al. , Extending the Limits of Quantitative Proteome Profiling with Data-Independent Acquisition and Application to Acetaminophen-Treated Three-Dimensional Liver Microtissues. Molecular & Cellular Proteomics, 2015. 14(5): p. 1400–1410. [DOI] [PMC free article] [PubMed] [Google Scholar]
- 40.Hughes CS, et al. , Investigating Acquisition Performance on the Orbitrap Fusion When Using Tandem MS/MS/MS Scanning with Isobaric Tags. Journal of Proteome Research, 2017. 16(5): p. 1839–1846. [DOI] [PubMed] [Google Scholar]
- 41.Kelstrup CD, et al. , Performance Evaluation of the Q Exactive HF-X for Shotgun Proteomics. J Proteome Res, 2018. 17(1): p. 727–738. [DOI] [PubMed] [Google Scholar]
- 42.Muntel J, et al. , Comparison of Protein Quantification in a Complex Background by DIA and TMT Workflows with Fixed Instrument Time. J Proteome Res, 2019. 18(3): p. 1340–1351. [DOI] [PubMed] [Google Scholar]
- 43.Geladaki A, et al. , Combining LOPIT with differential ultracentrifugation for high-resolution spatial proteomics. Nat Commun, 2019. 10(1): p. 331. [DOI] [PMC free article] [PubMed] [Google Scholar]
- 44.Breckels L, et al. , A Bioconductor workflow for processing and analysing spatial proteomics data [version 2; referees: 2 approved]. F1000Research, 2018. 5(2926). [DOI] [PMC free article] [PubMed] [Google Scholar]
Associated Data
This section collects any data citations, data availability statements, or supplementary materials included in this article.
Supplementary Materials
Table S1. Instrument settings for TMT-MS2 and TMT-MS3 in ML-rate zonal
Table S2. Data acquisition methods for differential centrifugation/Nycodenz fractions.
Table S3. Data acquisition methods for ML-rate zonal fractions
Table S4. Processed filtered quantifications of differential-Nycodenz using TMT-MS2 after normalization, filtering and constraining to a common scale so that the values of fractions sum to 1
Table S5. Processed filtered quantifications of differential-Nycodenz using TMT-MS3 after normalization, filtering and constraining to a common scale so that the values of fractions sum to 1
Table S6. Processed filtered quantifications of differential-Nycodenz using MS1 after normalization, filtering and constraining to a common scale so that the values of fractions sum to 1
Table S7. Processed filtered quantifications of differential-Nycodenz using DIA after normalization, filtering and constraining to a common scale so that the values of fractions sum to 1
Table S8. MetaMass quality metrics for analysis of differential-Nycodenz fractionation by TMT-MS2
Table S9. MetaMass quality metrics for analysis of differential-Nycodenz fractionation by TMT-MS3
Table S10. MetaMass quality metrics for analysis of differential-Nycodenz fractionation by MS1
Table S11. MetaMass quality metrics for analysis of differential-Nycodenz fractionation by DIA
Table S12. Markers list used for MetaMass analysis
Table S13. Number of markers proteins per organelle used for MetaMass analysis.
Table S14. Statistics of assigned proteins and peptides of ML-rate zonal (analyzed with differential/Nycodenz)
Table S15. Statistics of assigned proteins and peptides of Differential/Nycodenz (analyzed with ML-rate zonal)
Fig. S1. Distribution of precursors with weighted idotp.
Fig. S2–S4. PCA analysis of peptides using all four quantitative proteomics methods.