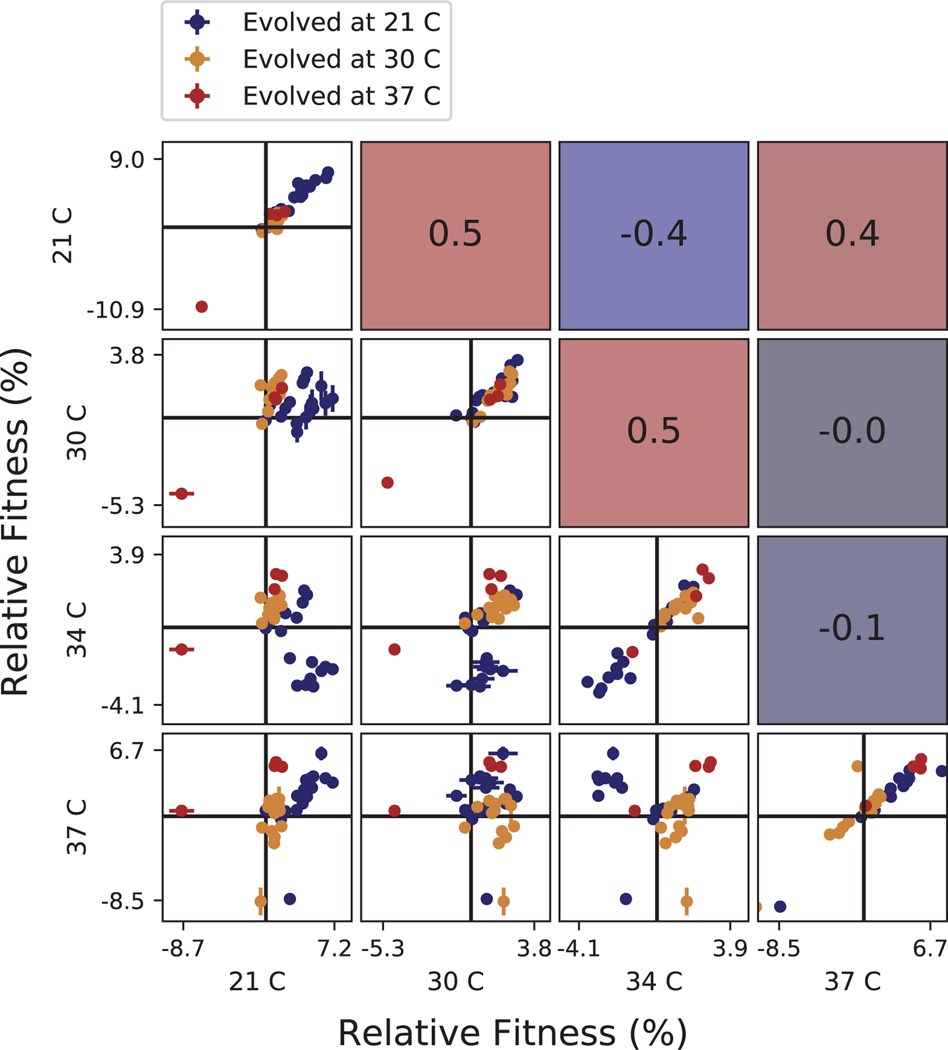
Extended Data Fig. 6. Correlations between clone fitness in different temperature conditions.
Each panel below the diagonal shows clone fitness in a particular pair of environments. (Error bars: ± 1 SE on clone fitness.) The diagonal shows the correlation between technical replicates in the fitness assay in each condition. Panels above the diagonal are colored by and display the Pearson correlation coefficient between clone fitness in the corresponding pair of environments.

