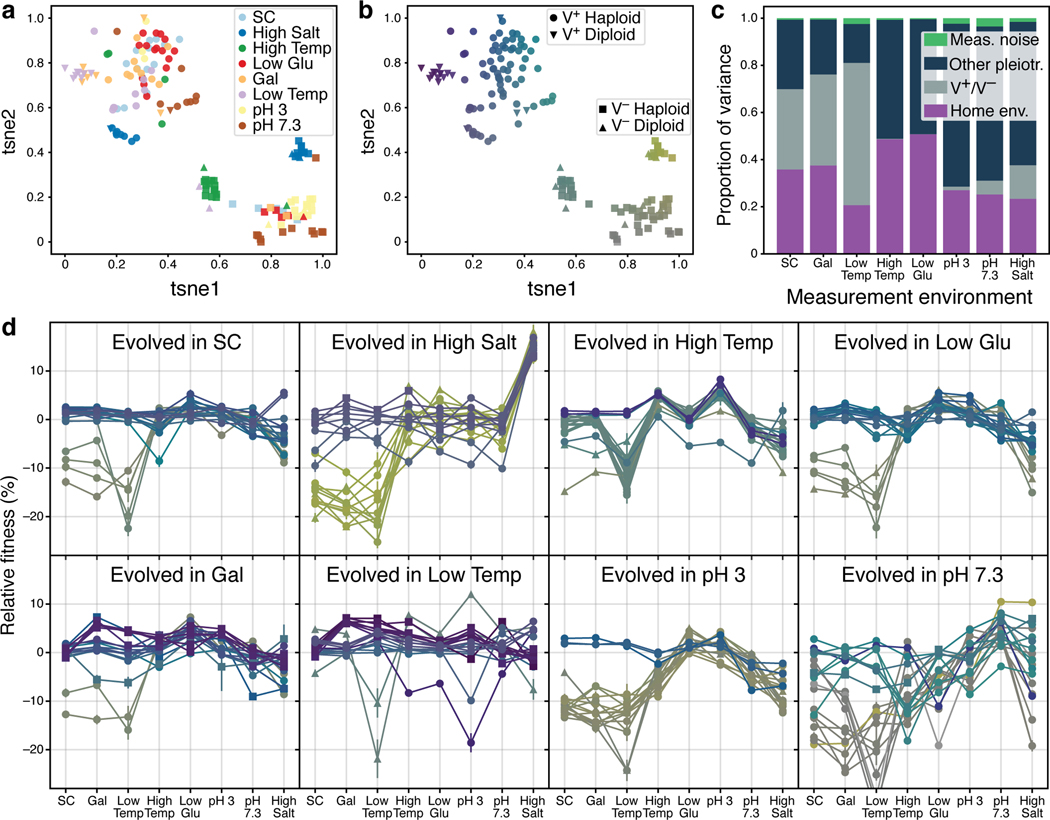
Fig 2. Environmental and stochastic determinants of pleiotropic profiles.
a, t-SNE dimensional reduction of the pleiotropic profiles. Each point represents a clone; the eight-dimensional vector of clone fitness across the eight conditions was projected into two dimensions using t-SNE. Clones are colored according to home environment. b, t-SNE projection as in panel a. Colors are assigned based on the t-SNE coordinates to establish visual correspondence between this projection and the full pleiotropic profiles shown in panel d. c, Proportion of the variance in clone fitness in each environment that is attributable to (in this order) home environment, V+/V− phenotype, other pleiotropy (unexplained variance), measurement noise. Clones are excluded from their own home environment. d, The pleiotropic profiles of clones from each home environment. Profiles are colored as in panel b. Error bars represent ±1 SE on clone fitness.

