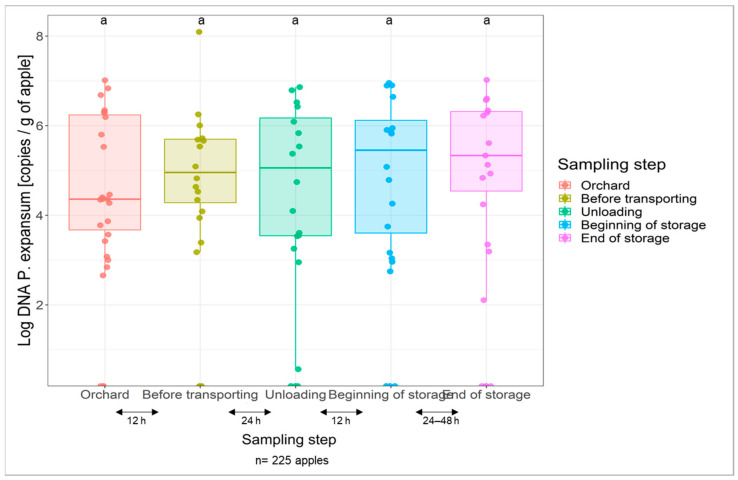
Figure 4.
Boxplot illustrating the DNA amounts of P. expansum per g of apple on the surface of 225 cider-apples sampled at the orchard and at different post-harvest steps. The fungal abundance within each step was measured in three replicates by qPCR. P. expansum is present on the surface of apples at the orchard and is maintained throughout the post-harvest steps. One-way ANOVA test showed no significant difference for fungal biomass at the sampling stages.

