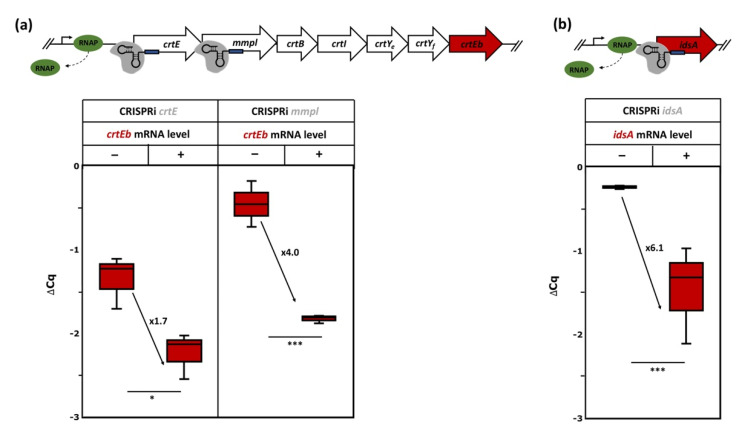
Figure 6.
Schematic representation of the crt operon and idsA and qRT-PCR analysis of crtEb RNA levels upon CRISPRi targeting of crtE or mmpL (a) or of idsA RNA levels upon CRISPRi targeting of idsA (b). Cells exponentially growing in 40 g L−1 of glucose CGXII minimal medium with (+) or without (−) induction using 1 mM IPTG and 0.25 µg mL−1 of aTc were analyzed. Mean values and standard deviations of three biological replicates are given. The p-values of <0.001 (***), and <0.05 (*) were calculated using Student’s t-test (two sided, unpaired). For abbreviations, see Figure 3.

