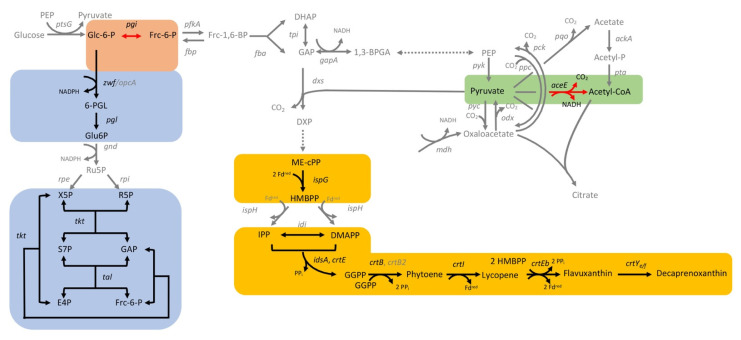
Figure 10.
Scheme of C. glutamicum metabolism with CRISPRi target genes that significantly improved (red arrows) or reduced (black arrows) decaprenoxanthin biosynthesis in C. glutamicum when repressed. Grey is used to depict all other reactions in glycolysis (orange shading), the pentose phosphate pathway (blue shading), the TCA cycle (green shading), as well as the MEP pathway and the carotenogenesis (yellow shading). Abbreviations are explained in Figure 3.

