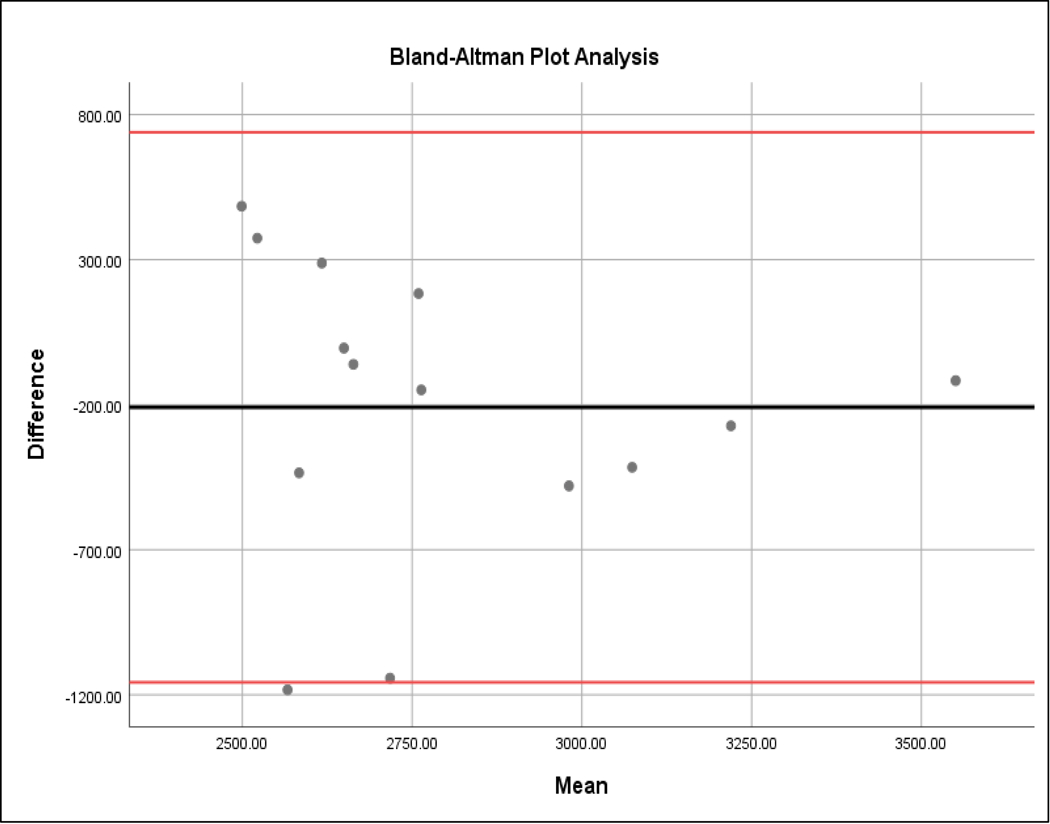
Figure 3.

Bland-Altman plot relating the difference between smartphone and Konan ECD values. On the x-axis is the mean of the smartphone ECD and Konan ECD measurements (cells/mm2). On the y-axis is the difference between the two measurements (i.e. Smartphone count – Konan count in cells/mm2). The solid middle horizontal line represents the mean difference of −209 cells/mm2, and the upper and lower red lines represent the 95% confidence interval (−1011 to 573). Eight data points lie above the median while six are below.
